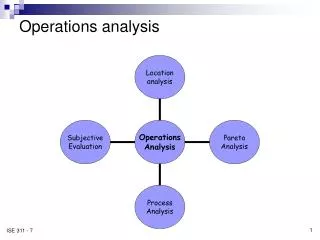
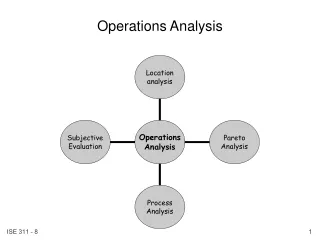
Operations Analysis Focus Group
Operations Analysis Focus Group Kickoff Meeting September 18-19 AA HQ Dallas, TX December 2000 Deliverables (Russ Chew presentation to FFSC) Process Strawman for a key market Operations Analysis value of market (estimate of RPMs) Define system performance constraints


Operations Analysis Focus Group
E N D
Presentation Transcript
Operations Analysis Focus Group Kickoff Meeting September 18-19 AA HQ Dallas, TX
December 2000 Deliverables (Russ Chew presentation to FFSC) • Process Strawman for a key market • Operations Analysis • value of market (estimate of RPMs) • Define system performance constraints • Differentiate by en-route, terminal, and airport • Recommend Integrated Solutions • identify candidate operational enahancements • Develop Aggregate Business Case • Finalize schedule for follow-on activities
Value of Market • How to define market – importance of market • Revenue ($) • Passengers • Traffic (jet operations) • RPMs • Things to consider • Growth (GDP / Demand) • Capacity constraints • Schedule creep • Impact of RJ’s by market until 2005. – traffic mix . Paint the picture, but don’t include in analysis.
Value of MarketAction ItemsDue October 3rd • Assume top 100 markets • Get Data • Revenue, -- Joe Sinnott • Passengers, Joe Sinnott • RPM - Joe Sinnott • Traffic Joe Sinnott • Size of Delay Dave Richards, Joe Sinnott, Jady Handal, • Tell us what delay data is available, including data limitations. Use existing data and develop guidelines for better data collection • Block Creep Data. Kathleen to see what's out there. Lmi, NASA, DOT. Rose. • Telecon to review data and make decision on first market to evaluate • October 6th. 9AM PST. Allow 3 hours.
System Performance Constraints • Use July 1999 data • not using 2000 data because of UAL pilot action • using July because DSR transition problems not an issue • Map delay vs. operations for July • Determine high delay days (I.e. “operationally challenged”) and correlate to ATC constraint • use UAL weather data • contact command center for ATC programs in effect • FAA Opsnet data may be able to categorize delay by cause • FAA outage databases • other data? • Compare ATC delay/cancellation information between good days and “operationally challenged” days • ASQP has cancellation data • Develop a process to prioritize problems and give to Integrated Solutions FG
System Performance ConstraintsAction Items • Use July 1999 data • UAL and AAL to provide delay and cancellation data (Rose will talk to CO) • flight planned vs actual • Kathleen to get OAG data for market region • Map delay vs. operations for July • Kathleen will do • Compare ATC delay/cancellation information between good days and “operationally challenged” days • Determine high delay days and identify constraints • look for ATC-related delays only • airlines will take first cut in individually assessing constraints • C/AFT meeting to compare notes and reach consensus • Oct 24 pm - 26 in Seattle • Prioritize problems and give to Integrated Solutions FG • Will do this at October meeting.
Potential Data Sources • Revenue. DOT 10% ticket. MITRE< Database Products. • Passengers. Ditto • Traffic. CODAS. • OAG. Number of flights, ASM etc…, broken by carrier. • Delay level. • "GDP" of cities. Economic strength - like Boeing CMO • Average aircraft densities over regions - MITRE • TAF has enplanements and operations back into 80's. • LMI traffic growth • Fabricated OAG for RJs from MITRE
Potential Data Sources • Airplane Total delay per market. CODAS, ETMS, • ATA ranking of hub airports by average passenger connection - ask Margaret Kim (Rose - the longer the connection time at a hub more likely that there are capacity issues at that location) • Schedule creep. NASA? In IG report on delays. MITRE? Hard to find schedule creep directly related to ATC. Duo Long. They did a study to look at O/D pairs with same equipment type and same airlines. Rose cautions that each 737 model, for example, has its own speed. American has done a study, 1997 - 2000. Can look overall at how block time has increased. • Initiative of secretary of transportation, focus is taking care of flying public. They might have some data.
Potential Data Sources • FAA Choke Points -- Johnny Walker’s group • 03-05 Analysis -- formed basis of FFP2 activities. • LMI traffic growth studies