Download

1 / 33
340 likes | 518 Vues
The Effect of the Apparent Baseline on Fringe Amplitude and Period. By Dana Dawson Rhonda Tully July 2004 MST 562. Purpose.

E N D
The Effect of the Apparent Baseline on Fringe Amplitude and Period By Dana Dawson Rhonda Tully July 2004 MST 562
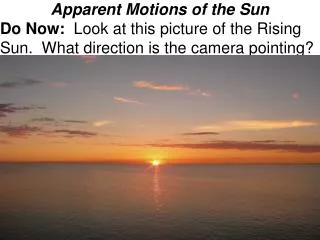
Purpose Use an interferometer to compare the effect that the apparent baseline length has on the fringe amplitude and period pattern of radio waves emitted by the sun at different positions in the sky. This is not an interferometer but we liked this picture…
Hypothesis • The fringe amplitude will increase when the sun is directly overhead • The fringe period will decrease as the amplitude increases.
Background Research • Sensitivity- increases as the diameter of the dish increases • Resolution- increases as the diameter of the dish increases • There are physical limits to dish size
What is interferometry? • A simple interferometer involves the combining of signals from two telescopes. • The distance between the telescopes, combined in this fashion, effectively becomes the diameter of the collection instrument.
What is interference? • Interference is a phenomenon that occurs when multiple waves come together at the same time and at the same place. • The amount of interference depends on how out of phase the waves are with respect to each other and their amplitudes.
N D*cos(θ) (Apparent baseline) θ D*sin(θ) Baseline D (Distance between elements) What is the geometry of the interferometer? • Radio waves reach the elements at different times due to the rotation of the earth • Radio waves will reach the right element first • Radio waves that reach the left element will travel farther
What is a fringe? • The addition of radio waves produces interference fringes. • The amount of interference depends on how out of phase the waves are with respect to each other and their amplitudes.
Global maxima Local minima1 Local minima2 Formulas – Fringe Amplitude • Relative Fringe Amplitude= • Visibility Fringe Amplitude = • b=apparent baseline • λ=observing wavelength • ά=source size
Formulas – Fringe Period • Fringe Period = t = time b=separation of the dishes =angle of declination of the Sun E=how fast the Earth turns H0=hour angle
Why do we use interferometry? • The distance between the telescopes, combined in this fashion, effectively becomes the diameter of the collection instrument. • Increase angular resolution and sensitivity.
Equipment/Materials • Interferometer • (Etscorn) • Computer system to point telescopes and collect data 24 m baseline 2.1m dishes
Procedure Observe Sun • local noon (1:00 pm) • 2 hours before local noon (11:00) • 2 hours after local noon (3:00)
Procedure • Set-up the interferometer • Initiate data collection • Run drift scan • Point the interferometer 5° ahead of Sun • Take readings every 3 sec
Data • 5 drift scans were made • 10:40 am MST • 11:07 am MST • 1:09 pm MST • 3:16 pm MST • 3:31 pm MST
Observations • 10:30 MST • Antenna Coordinate: azel 103.8 56 deg • Sun: radec 7.8 hrs 20.7 deg
Observations • 11:07 MST • Antenna Coordinate: azel 110.2 61.2 deg • Sun: radec 7.8 hrs 20.7 deg
Observations • 1:09 MST • Antenna Coordinate: azel 187.1 76.5 • Sun: radec 7.8 hrs 20.7 deg
Observations • 3:16 MST • Antenna Coordinate: azel 253.6 58.2 • Sun: radec 7.8 hrs 20.6 deg
Observations • 3:16 MST • Antenna Coordinate: azel 257.4 54.8 • Sun: radec 8.0 hrs 20.6 deg
Results – Apparent Baseline • Apparent baseline did vary • Maximum apparent baseline approached the actual baseline at noon standard time or 1:09 pm daylight savings time.
N D*cos(θ) (Apparent baseline) θ D*sin(θ) Baseline D (Distance between elements) Results – Extra Length Traveled • Extra length traveled by the radio waves to reach the second element of the interferometer
Results – Fringe Amplitude • The primary fringe amplitude varied with the apparent baseline length. • The maximum fringe amplitude occurred when the apparent baseline was the longest.
Results - Theoretical • Observed amplitudes follow the same trend as the theoretical for the first two and last two observations, but is significantly different for the third observation.
Results – Amplitude Relative Size • Comparison of the ratio of amplitudet/amplitudet+1 for both the observed and theoretical amplitudes • Compare relative sizes of the amplitudes. • Trends are comparable for the first two observations and the last two observations and significantly different for the third observation.
P1 P2 P3 Results - Period • The average period of the fringe decreased during the observation day
Results - Theoretical • The experimentally observed fringe periods agree with the theoretical values somewhat for the first three observations but is significantly different for the last two observations.
Conclusions • The amplitude of the fringe pattern collected with the interferometer did increase during the observation where the apparent baseline was close to the actual baseline, • The fringe period did decrease as the amplitude increased as expected. • Further investigation is necessary to resolve discrepancy between observed and theoretical results.
VIBA Very Itty Bitty Array VIBA The Very Itty Bitty Array
References • Moran, James M., George W. Swenson,Jr., and A. Richard Thompson. Interferometry and Synthesis in Radio Astronomy. New York: John Wiley and Sons, Inc., 2001. • Westpfal, David. The Adding Radio Interferometer. National Radio Astronomy Observatory. NRAO, Socorro, NM. • What is Radio Astronomy? 11 Mar. 2003. National Radio Astronomy Observatory. 7 July 2004 <http://www.nrao.edu/whatisra/radiotel.shtml>.
Acknowledgements • Dr. Mark Clausen • Dr. Robyn Harrison • Dr. Lisa Young