Download
1 / 59
620 likes | 926 Vues
Contract 1000-203 Port Khalifa Port Special Systems. Port Operating System (POS) Workshop – Overview. Workshop Objective. Realization of POS for: Security Command and Control Utilities and Building Infrastructure Supervision Port Special Systems Health Monitoring

E N D
Contract 1000-203 Port Khalifa Port Special Systems Port Operating System (POS) Workshop – Overview
Workshop Objective • Realization of POS for: • Security Command and Control • Utilities and Building Infrastructure Supervision • Port Special Systems Health Monitoring • User’s interface with POS Elements • Gate for POS Configuration
Port Operating System (POS) Workshop Realization of POS
POS-PSS Interfaces – Functional Groups Access Control System POS CCTV Master ClockSystem Offshore Gate Management System(ADT) IT Data Network and Wireless LAN Gate Management System Perimeter Security Systems Integrated Building Management System Port Operations Telephony System Vessel Traffic Services Local BMS Utilities & Infrastructure PA/VA System Pumping Stations Fire Alarm System Sewage System Asset Management System UPS
Port Operating System (POS) Workshop User’s Interface with POS Elements
POS Elements • Point of Presence • Data Centre – Data Centre & Terminal Operations buildings • Control Room – Control Centre & Harbour Master buildings • Outside Control Room – Control Centre & Harbour Master buildings • Stakeholder Access Point – select buildings • List • Redundant Servers • Quad Head Port Operations Workstation • Video Wall • Quad Head Utilities & Infrastructure Supervision Workstation • Engineering & Training Workstations • Single Head Stakeholder Workstation
User’s Interface • Quad Head Layout • Video Wall Layout • Stakeholder Access • Navigation Hierarchy • User Groups, Roles & Access Privileges • Alarm / Alert Management • Automatic Actions / Business Logic • Reports and Business Communication • Workstation Locations
User’s Interface with POS Elements Quad Head Layout
Quad Head Layout – Control Room (Port Operations) • Interaction through mouse, keyboard and touch • 21” diagonal touchscreens • Adjustable tilt/swivel, height and reach • Application layout per user-profiles Alarm Console Main UI Video Console Reports, Video Wall Management, PSS Applications, Business Applications
User’s Interface with POS Elements Video Wall Layouts
Video Wall Layout – Control Room (Port Operations) • Cube • 70” diagonal • 4:3 aspect ratio • 1400 x 1500 resolution and dimension in mm • 5100:1 dynamic contrast • 2 lamps in cold standby configuration • 16 pictures-in-pictures • Video Wall • 5 cubes in a row • 2 rows • 7000 x 2100 resolution and dimension in mm • Controller • 4 video inputs from each POS workstation in control room • Server for video wall management client • Every video input displayable at any position and size • Two layouts / scenarios – routine and emergency
Video Wall Layout – Routine Port Operations Navigation Hierarchy Event Monitor Video Matrix Maps Alarm Stack Satellite TV
Video Wall Layout – Incident / Emergency Map and Alert Information Incident Video Alarm Stack Satellite TV Incident Video
User’s Interface with POS Elements Stakeholder Access
Stakeholder Access • Access points available at select buildings • Limited to the geographic area around the point of presence (building and its adjoining vicinity) • Single Head Layout • Interaction through mouse, keyboard and touch • 21” diagonal • Application layout per user-profiles Stakeholder UI
User’s Interface with POS Elements Navigation Hierarchy
Navigation Hierarchy • POS GUI is navigated through a tree hierarchy which is the first step in GUI configuration. • Structure based on a mix of functional / operational groups and geographical zones. • Sensor icons are placed on monitoring areas. • Areas comprise monitoring zones.
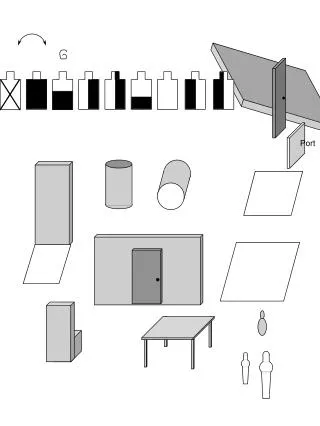
Maps and Graphics • Port Operations maps source: • Monitoring zones and areas – aerial images • Inside buildings – civil construction floor plans in black and white • Utilities and Infrastructure graphics source: • P&ID for mechanical plants • SLD for electrical systems • D&ID for HVAC systems
Khalifa Port Geographical Zones Onshore Terminal Causeway Offshore
Onshore Zone Clusters Container Freight Station Cluster Customs Cluster Gates Cluster Control Centre Cluster
Container Freight Station Cluster Zone Container Freight Station Auxiliary East Auxiliary West Substation 8 Substation at CFS Container Repair Workshop
User’s Interface with POS Elements User Groups, Roles & Access Privileges
Application of User Groups and Roles • Access privileges are assigned to zones per User Group. • Access privileges are assigned to GUI components per User Role. • List of end-user groups, roles and users required.
Khalifa Port Roles and Groups Roles Groups Groups
User’s Interface with POS Elements Alarm / Alert Management
Alarm / Alert Notification • New alerts are notified as: • Popup • Audio beep • Row in alert list pane and alert console • Flashing alert severity icon on the respective monitoring area node and all the monitoring zones above in navigation pane • Flashing alert severity icon on the respective monitoring area map for the sensor in alarm • Alert severity indications: • Critical • High • Medium • Low
Alarm / Alert Management • Alert is associated with a sensor – alert is traceable to a unique COID • Comprehensive alert detail window • Acknowledgement of an alert is local to POS • Alert is closed: • Automatically upon status update from PSS • Manually from the alert detail window • Alerts can be filtered in alert console based conditions applicable on: • Severity • Status • Sensor Name / COID • Alert Type • Alerts can be escalated to an individual user or group
User’s Interface with POS Elements Reports and Business Communication
Reports • Create reports from alert detail window. • Create alert trend reports and graphs. • Print reports and graphs. • Save reports to file – PDF, HTML, RTF, etc.
User’s Interface with POS Elements Automatic Actions / Business Logic
Automatic Actions • POS executes business logic to perform automatic actions configured for alerts • All automatic actions are listed in the “Cause & Effect” chart • Effects are: • Move associated camera to area of interest and zoom level • Push live video of associated camera onto Event Monitor on Video Wall • Trigger event video recording at 25 fps • Notify alert in POS • Trigger reactive maintenance work order in AMS • Send email to maintenance personnel • List of email addresses and mobile numbers assigned to effects required.