Download
1 / 67
720 likes | 1.01k Vues
Chapters 17 and 18 Business Dynamics by John D. Sterman. Supply Chains and the Origin of Oscillations. Chapter outline. What is a supply chain? Supply Chains in Business and Beyond The Stock Management Problem The Stock Management Structure Origin of Oscillations Summary. Homework:.

E N D
Chapters 17 and 18Business Dynamics by John D. Sterman Supply Chains and the Origin of Oscillations Chapters 17 and 18 in Sterman
Chapter outline • What is a supply chain? • Supply Chains in Business and Beyond • The Stock Management Problem • The Stock Management Structure • Origin of Oscillations • Summary Chapters 17 and 18 in Sterman
Homework: • Work the challenge questions on pages 674 and 675—questions 1 through 7 Chapters 17 and 18 in Sterman
§ What is a supply chain? • A supply chain (SC) is the set of structures and processes an organization uses to deliver an output to a customer • tangible or intangible product • Typically, supply chains consist of • Stock and flow structures for the acquisition of the inputs to the processes, and • Management policies governing the various flows Chapters 17 and 18 in Sterman
Why study SC Dynamics? • SCs often exhibit persistent and costly instability • Many business and social systems are notorious for producing counter intuitive behavior (Forrester, Sterman) • Understanding the behavior of SCs under important contexts is imperative for better management (Recall–Mental Models’ limitations- first week’s lesson) Chapters 17 and 18 in Sterman
The bane of Supply Chains—Uncertainty • Uncertainty in the forecast • Uncertainty in procurement details • lead time • Procurement amount • Procurement product quality Chapters 17 and 18 in Sterman
How to deal with the Uncertainty—buffer it with INVENTORY or reduce it with IT • What is IT? • But this totally changes the dynamics of the SC System Information Technology Chapters 17 and 18 in Sterman
Without VISIBILITY… • Supply chains exhibit a behavior called simply the hockey-stick phenomenon Chapters 17 and 18 in Sterman
Approach-some premises • Stock management structure is used to explain origin of oscillation • Preconditions for oscillation are-negative feedbacks and time delays present in the system (recall-desired inventory model) • Delays are simple enough to notice, yet are often omitted in decision making (experimental evidence supports) Chapters 17 and 18 in Sterman
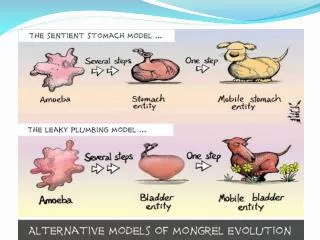
§ SCs in Business and Beyond • SCs extend beyond the boundaries of a firm (organization) and include the suppliers, distribution channels, and the customers (Recall-definition of a SC) • SD models need to include these players as well, to the extent the flows and rules within the firm cause feedback from these players giving rise to further dynamics in behavior of stocks • SCs are not limited to business--consider human body- supply of glucose for energy-consumption-food ingestion-digestion-storage-consumption etc forms one big supply chain Chapters 17 and 18 in Sterman
SC-what to expect? • SC-to provide right output at right time • As requirements change, adjustments in flow rates are initiated-and the negative feedback loop is at work! Production and inventories chronically overshoot and undershoot (17.1) • Due to time delays-SCs are prone to oscillate • Amplitude of fluctuations increases as they propagate from customer to supplier- each upstream stage lags behind its customer • Oscillation, amplification, and phase lag are pervasive in SCs Chapters 17 and 18 in Sterman
SC Dynamics Understanding Process • Understand the internal dynamics and structure within the firm • Understand the dynamics and structure outside the firm Chapters 17 and 18 in Sterman
§ Stock Management Problem • Consider a single firm structure • Desired versus actual state-of stock • Typically, outflow rate is independent • Managers need to regulate inflow to keep the stock level close to desired level • We all deal with such feedback loops- adjust temperature in shower, manage checking account balance, credit card account balance, etc Chapters 17 and 18 in Sterman
The problem • Two parts: Structure and Rules • If there is no delay in acquisition (instantaneous replenishments) • Stock to be controlled S is the accumulation of AR and LR S=INTEGRAL(AR-LR, Sto) (17-1 pp 668) Chapters 17 and 18 in Sterman
We have studied this structure before… Chapters 17 and 18 in Sterman
This is just a Balancing Loop… Chapters 17 and 18 in Sterman
It gave us Balancing Loop behavior that looked like this… • Called Exponential Goal-Seeking Chapters 17 and 18 in Sterman
We can re-arrange this model …. • Without changing behavior… • Here, AS = (S* - S) / SAT and AR = AS Chapters 17 and 18 in Sterman
We still get the same exact behavior… Chapters 17 and 18 in Sterman
Now, we add a Loss Rate • Akin to a Sales Rate, a Depreciation Rate or whatever… Chapters 17 and 18 in Sterman
Now we see the problem…. Chapters 17 and 18 in Sterman
Let examine the Acquisition Rate… Chapters 17 and 18 in Sterman
How does the Acquisition Rate look in relation to the Loss Rate? Chapters 17 and 18 in Sterman
The problem is Stock S…. • Will never reach the Desired Stock S*, but will always differ from it by a significant amount—600 units in this case • Notice that, in steady state, the Acquisition Rate settles down to the Loss Rate Chapters 17 and 18 in Sterman
Loss Rate - LR • Loss Rate -outflow rate- may arise from usage (material or wip) or decay (depreciation) and must depend on stock itself (also to prevent negative draining) • LR may depend on exogenous variables X • LR may depend on endogenous variables U LR = ƒ (S, X, U) … (17-2 pp 668) Chapters 17 and 18 in Sterman
The Loss Rate… • LR = IF THEN ELSE( Stock S > 0 , Variables XU , 0 ) Chapters 17 and 18 in Sterman
How can we fix the problem we just observed…. • Namely, that the Stock S will always differ from the Desired Stock S* by the amount of the Loss Rate LR???? • This will make inventory managers very unhappy because they cannot achieve their targeted service levels—many customers will arrive to buy but no stock will be available Chapters 17 and 18 in Sterman
A way to fix the problem • Create a new variable called the DAR—Desired Acquisition Rate… • DAR = Adjustment for Stock + Loss Rate • DAR = AS + LR Chapters 17 and 18 in Sterman
Here DAR = AS + LR Chapters 17 and 18 in Sterman
A better way… Chapters 17 and 18 in Sterman
We can always… • Reconstruct the information created in a rate elsewhere without having to take information directly from a rate, as Sterman does here Chapters 17 and 18 in Sterman
Now let’s look at Behavior… Chapters 17 and 18 in Sterman
Acquisition Rate - AR • Typically production requires use of resources, hiring requires efforts-or time delays • If no such delays- refer to model (pp 669) • AR=MAX(0, DAR) (17-3 pp 668) • Max function coupled with 0 ensures positive or zero AR-prevents negative AR • If excess units are returnable, that needs to be modeled separately and not by negative AR Chapters 17 and 18 in Sterman
If Desired stock changes • Adjustment for stock AS needs to change • Consider example STOCKMGT.MDL from chapter 17 or 17-4 on pp 669 • Desired acquisition rate formulation can depend on several factors- this needs to be modeled based on information available to managers- typically managers use heuristic rules (falls under ‘Bounded Rationality’ domain) • DAR=EL+AS (17-4 pp 670) • EL=expected loss (= LR here) • AS=Desired-actual/time delay (=0 here) Chapters 17 and 18 in Sterman
EL and AS formulations • Actual Loss is difficult to measure-prone to change-hence EL-avg • In certain situations LR may not be directly observable or measurable-must be estimated-introducing measurement, reporting and perception delays- think about trend in sales • Creates a negative Stock control feedback loop- simplest form-linear • AS = (S* - S)/SAT (17-5 pp 671) • SAT= Stock adjustment time • S* =desired stock level-(could be a CONSTANT or variable) Chapters 17 and 18 in Sterman
§ Steady State Error • Omission of EL in DAR leads to Steady State error- stock differs with desired value even in equilibrium • Production=(DI-I)/IAT …(17-6 pp671) • Equilibrium condition: Production=shipments • Production=(DI-I)/IAT=shipments… (17-7) • I=DI-Shipments*IAT … (17-8) When in equilibrium the Inventory will be lower than Desired Inventory Chapters 17 and 18 in Sterman
Fix for Steady State Error • Including the EL in the production decision will fix this steady state error • Production=AvgOR+(DI-I)/IAT…(17-6a) • Equilibrium: Avg Orders= Actual Orders, I=DI, and Orders=Shipments • Avg OR- to smooth out sharp spikes- and avoid costly changes in production • Evidence suggests that managers do include EL in production decisions Chapters 17 and 18 in Sterman
Managing a Stock: Behavior • Consider example-Plant & Equipment • Avg life time = 8 yrs • Delays in reporting negligible EL=AL • Adjustment time = 3 yrs (Senge, 1978) • Desired Capital stock=exogenous; it depends on demand for firm’s products • Net Change in Capital Stock= (S*-S)/SAT (17-9)- the first order linear negative feedback system Chapters 17 and 18 in Sterman
System response to a change • Step (1, .20) produces changes in AR • Amplification in AR-for a mere 20% increase in desired stock 19.2/12.5%= 53% at peak • Amplification - temporary- disequilibrium stage • If stock is to increase then AR>LR • Since AR=receipts from suppliers- a 20% increase in the operations impacts supplier more than the firm (although temporarily) • Try at least 3 tests suggested on page 674 (#4 in particular) Chapters 17 and 18 in Sterman
BOT Chart of Stock Chapters 17 and 18 in Sterman
BOT Chart of rates Chapters 17 and 18 in Sterman
§ The Stock Mgmt Structure • Delay between order and acquisition • Capital stock—construction starts/delivery time • Workforce--hiring /training time • Supply Line introduced-refer model (pp 676) • SL=INTEGRAL(OR-AR, SLto)…(17-10 pp 675) • AR=L(SL, AL) …(17-11 pp 675) • Most likely AR=SL/AL • AL =ƒ(SL, X, U) …(17-12 pp 675) • L() denotes the material delay • Typically average acquisition lag is relatively constant until requisition rate exceeds capacity Chapters 17 and 18 in Sterman
The Stock Mgmt Structure… • Typically, OR=Max(0,IO) …(17-13) • Cancellations of orders need to be modeled as distinct outflows from SL • IO=DAR+ASL … (17-14) • ASL=(SL*-SL)/SLAT similar to AS ..(17-15) • SL*=EAL * DAR …(17-16) • Managers use SL*=EAL*EL …(17-16a) • not sophisticated- instead use avg loss rate • Revised DAR=MAX(0,EL+AS) …(174a) • To ensure a non negative DAR Chapters 17 and 18 in Sterman
Oscillations—how do we get them?? • Oscillations require delays, which involve additional stocks (states) • Negative Feedback systems without delays will not oscillate • Delays between corrective actions and their effects create a supply line of corrections that have been initiated but not yet had their impact Chapters 17 and 18 in Sterman
More on oscillations • To oscillate the time delay must be at least partially ignored • Managers must continue to initiate corrective actions in response to the perceived gap between the desired and actual state of the system, even after sufficient corrections to close the gap are in the pipeline Chapters 17 and 18 in Sterman
The Beer Distribution Game • Originally developed by Forrester in the 1950’s • Consists of a supply chain of four entities • Retailer • Wholesaler • Distributor • Factory • Each entity has the same exact structure Chapters 17 and 18 in Sterman
The Beer Distribution Game • One person assumes the role of each entity • At each stage there are order processing and shipping delays • Each player’s objective is to minimize holding costs and stockout costs • Holding costs run $.50 per case per week • Stockout costs run $1.00 per case per week Chapters 17 and 18 in Sterman
The Beer Distribution Game • Incoming orders deplete inventory • Players must try to maintain a ‘desired’ inventory • Pattern for customer demand is: • Starting from equuilibrium, there is a small unannounced one-time increase in customer orders from 4 to 8 cases per week. Chapters 17 and 18 in Sterman
Beer Distribution Game Behavior • Most players develop a backlog—meaning negative actual inventory • Eventually inventories throughout the supply chain start to rise • But then all entities inventories overshoot • See page 687 Chapters 17 and 18 in Sterman
Beer Distribution Game Behavior • Most players ignore the delays and order the difference between their desired inventory and their actual inventory • This creates a huge overshoot in actual inventory when it all arrives Chapters 17 and 18 in Sterman