Download
1 / 17
221 likes | 326 Vues
Disaster mitigation has become a socioeconomic necessity due to increasing fatalities, damage, and destruction. The complexities of disaster mitigation arise from intricate public policy choices, coupled with the demand for natural resources, environmental degradation, and climate change issues. This century has seen a significant rise in disaster-related fatalities, particularly in economically less developed countries. By studying environmental geology, we can better understand the predictive value of scaling laws and population growth's impact on disaster mitigation strategies. For more information on the U.S. 20th-century natural disaster fatality-frequency plots and the interplay between economic prosperity, energy consumption, and carbon emissions, delve deeper into the critical field of environmental geology.

E N D
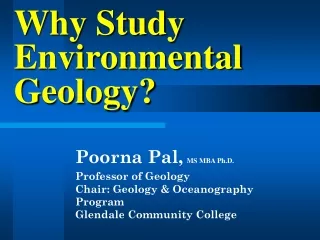
Why Study Environmental Geology? Poorna Pal,MS MBA Ph.D. Professor of Geology Chair: Geology & Oceanography Program Glendale Community College
Disaster mitigation has become • a socioeconomic necessity because of increasing • Fatalities • damage and destruction • an increasingly complex task because of intricate public policy choices in addition to the perennial problems of • a seemingly insatiable demand for the natural resources and • the attendant problems of environmental degradation and climate change.
Fatalities Since the 1970s, natural disasters have produced two-thirds of all disaster-related fatalities worldwide. Fatalities are more common in the economically less developed Third World than in the economically developed world. FOR MORE INFO... FOR MORE INFO...
Disasters* by type: 1971-96 High wind: 21% Total Fatalities worldwide: (1971-96) 8,219,000 Man-made disasters: 34% Flood: 19% Other natural disasters: 21% Earthquakes: 8% Volcanoes: 1% Landslides: 3% Drought & Famine: 6% * International Federation of Red Cross and Red Crescent Societies (The Economist, Sept 6, 1997) back
DISASTER FATALITIES* (1971-96: IN THOUSANDS) 0 4 8 12 16 MOSTLY FAMINE ETHIOPIA 48.4 BANGLADESH 31.9 MOSTLY FLOODS CHINA SUDAN MOSTLY MASS STARVATION MOSTLY FLOODS INDIA MOZAMBIQUE NICARAGUA IRAN PHILIPPINES SOVIET UNION/CIS STATES COLUMBIA GUATEMALA SOMALIA * International Federation of Red Cross and Red Crescent Societies (The Economist, Sept 6, 1997) HONDURAS PERU MEXICO NIGERIA back
Changes, in this century, in the number of deaths and cost of damage, in U.S. hurricanes (cost in billion 1996$) Deaths Damage back Source: Harvey Blatt: OUR GEOLOGIC ENVIRONMENT (Prentice Hall, 1997)
The Complexities of Disaster Mitigation Strategies • Predictive value of the scaling law and its implications for the public-policy choices. • Population Growth, Technology and Environmental Stress FOR MORE INFO... FOR MORE INFO...
The U.S. 20th Century Natural Disaster Fatality-Frequency Plots Floods 10 Tornadoes 1 Hurricanes Number of events per year 0.1 Earthquakes 0.01 1 10 100 1,000 10,000
This exponential scaling gives us three alternative choices • Flatten the curve • Steepen the curve • Lower the intercept
The Malthusian Trap World Stock Market2 Gross World Product1 50 All indexed to 1920 = 1 World Population1 10 5 1 J. Bradford DeLong: http://econ161.berkeley.edu/ 1 2 P. Jorion & W. Goetzmann: Journal of Finance, 54(3), June 1999 1900 1920 1940 1960 1980 2000 2020
10000 10000 1000 GDP, per capita, in inflation adjusted 2000 PPP$ 100 1000 World Population (in million) 10 1 100 10000 1000 100 10 1 Years Before the Present
6 6 100 4 4 World population (in billions) 10 Earthquake fatalities, (per million inhabitants) 2 2 1 1 0.1 0.1 0 0 0.1 0 1500 1600 1700 1800 1900 2000 1500 1600 1700 1800 1900 2000
Economic prosperity and energy consumption are closely correlated 100 USA China Russia Germany India Japan 10 Brazil Italy France U.K. Energy consumption (in terrajoules) Mexico Saudi Arabia Netherlands Spain Australia Sweden 1 Norway Swtizerland Singapore 0.1 0.01 0.1 1 10 GDP (PPP) in trillion US $
3 USA 1 China Russia 0.3 Japan Ukraine Poland Australia India Germany Canada U.K. 0.1 Kazakstan Italy France South Africa Brazil North Korea South Korea Mexico 0.03 Iran 0.03 0.1 0.3 1 3 10 … and so are economic prosperity and carbon emmissions Total Emission (billion tons C equivalent) GDP (PPP) in trillion US $
Colorado River 40 United States 30 Mexico 20 10 1900 1920 1940 1960 1980 2000 Sandra Postel: Forging a Sustainable Water Strategy (STATE OF THE WORLD 1996: Worldwatch Institute , 1996)
Drying of the Aral Sea 80 Aral Sea 60 40 20 0 1940 1960 1980 2000 Sandra Postel: Forging a Sustainable Water Strategy (STATE OF THE WORLD 1996: Worldwatch Institute , 1996)
Thus, the environmental stress attendant to population growth presents a catch-22 situation: • Poverty and deprivation enhance environmental stress. • But this stress is only aggravated by the technology that is needed to ameliorate the deprivation.