Importance of Safety in Science
Safety is crucial in science to ensure the well-being of students, protect equipment, and make informed decisions. Learn about variables, hypothesis, tools, models, and experiment design.

Importance of Safety in Science
E N D
Presentation Transcript
Why is SAFETY such an important issue in science? 130 120 60 70 30 50 40 10 140 8 7 6 5 4 9 3 2 0 180 80 20 160 90 150 170 100 110 1 Seconds Remaining. This screen will disappear in 3 minutes.
Safety is very important in science to keep students safe and healthy. It is also important to keep from damaging equipment and supplies.
Students saw advertisements for two brands of light bulbs.The students are unsure how to decide which brand of light bulb is the better buy. Describe two additional pieces of information that would help the students decide which light bulb is the better buy.– Explain how each piece of information will help the students make a decision. 130 120 60 70 30 50 40 10 140 8 7 6 5 4 9 3 2 0 180 80 20 160 90 150 170 100 110 1 Seconds Remaining. This screen will disappear in 3 minutes.
To make an informed decision, the students need to know how much each light bulb costs and how long each light bulb lasts. If they know these things, they can compare the savings with the longer life. Saving $0.50 on a light bulb that costs $2.00 is probably better than getting an extra 30 hours from a light bulb that lasts 3000 hours. But, if the light bulbs are more expensive or last a shorter time, then the longer light bulb life might be a better deal than saving $0.50. They cannot tell, though, without knowing the price and life of each bulb.
What are the three kinds of variables? 130 120 60 70 30 50 40 10 140 8 7 6 5 4 9 3 2 0 180 80 20 160 90 150 170 100 110 1 This screen will disappear in 3 minutes. Seconds Remaining.
The three kinds of variables are independent variables, dependent variables, and controlled variables.
Explain the term HYPOTHESIS 130 120 60 70 30 50 40 10 140 8 7 6 5 4 9 3 2 0 180 80 20 160 90 150 170 100 110 1 This screen will disappear in 3 minutes. Seconds Remaining.
A hypothesis is a special kind of prediction. It is an education guess about the relationship between variables. It can be tested with a scientific investigation. A hypothesis can be written as an If, Then statement.
Why do scientists use tools, such as thermometers and meter sticks, when they make observations? 130 120 60 70 30 50 40 10 140 8 7 6 5 4 9 3 2 0 180 80 20 160 90 150 170 100 110 1 Seconds . You have this much time remaining:
Tools help scientists make observations that are accurate and precise.
Why is it important for scientists to communicate their data? 130 120 60 70 30 50 40 10 140 8 7 6 5 4 9 3 2 0 180 80 20 160 90 150 170 100 110 1 You have this much time remaining: Seconds
It is important for scientists to communicate date so that other people can learn from them. • Also, communicating results lets other scientists repeat the experiment and verify it.
Why do scientists use models? Give an example of a model 130 120 60 70 30 50 40 10 140 8 7 6 5 4 9 3 2 0 180 80 20 160 90 150 170 100 110 1 You have this much time remaining: Seconds
Models let scientists observe things that are too big, too small, too expensive, or too dangerous to observe otherwise. • A globe is a model
List at least three things you should be careful to do when designing an experiment. 130 120 60 70 30 50 40 10 140 8 7 6 5 4 9 3 2 0 180 80 20 160 90 150 170 100 110 1 Seconds You have this much time remaining:
limit the number of variables being tested • conduct enough trials to get sufficient data • eliminate bias • prepare good data tables • consider safety • measure carefully
Students filled four identical glass beakers with the amount of water shown in the table below. Using a hot plate, the students heated the water in the two beakers to 60 °C and allowed the water to cool for a period of time. The water in the two other beakers was heated to 80 °C and allowed to cool for the same period of time. The table shows the final water temperature in each beaker. – What are two conclusions that the students should draw about factors affecting the cooling rate of water?– Use data to support these conclusions. 8 5 0 3 140 130 120 4 2 9 70 60 50 40 6 7 10 30 80 180 20 90 160 150 170 100 110 1 Time Remaining: Seconds
One conclusion is that the hotter water is, the faster it cools. For the 200 mL samples, the hotter sample lost 22 °C, and the cooler one lost 14 °C. For the 400 mL samples, the hotter one lost 13 °C, and the cooler one lost 8 °C. Another conclusion is that larger volumes of water cool more slowly. For the samples at 80 °C, the larger one lost 13 °C, and the smaller one lost 22 °C in the same amount of time. The cooler water samples followed the same pattern.
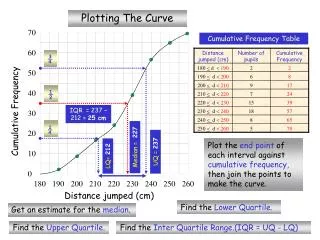
A group of students determined the percentage of electricity derived from various energy resources for two different regions. Their data is shown in the table above. – Which type of graph is MOST suitable for displaying this data?– Explain why.– Represent the data in two separate graphs. 130 120 60 70 30 50 40 10 140 8 7 6 5 4 9 3 2 0 180 80 20 160 90 150 170 100 110 1 Seconds Time Remaining:
A student wants to know if the mass of a magnet determines how strong it is.– Identify the tools needed to collect the data.– Describe in detail how the student could collect information to answer this question.– Explain how to analyze the data to draw a conclusion.– Draw and label the columns of a chart or table that could be used to organize the data collected in the experiment you describe. 130 120 60 70 30 50 40 10 140 8 7 6 5 4 9 3 2 0 180 80 20 160 90 150 170 100 110 1 Time remaining: Seconds
The tools needed for this experiment are magnets of different sizes, small objects that could be attracted to the magnets, and a measuring device such as a balance or spring scale. To collect data for this science experiment, students will need to know both the size and strength of different magnets. They could measure how many quarters can be suspended from each magnet. The data would be placed in a chart for comparison. The chart may look like this: Magnet Mass (grams) Number of paper clips held on one end 1 2 3
Look at the two plants in the experiment. Both plants are the same type of plant and received the same amount of water each day.–What hypothesis do you think the scientist was trying to study in this experiment?–Explain how the experiment helps to answer the scientist's question. 130 120 60 70 30 50 40 10 140 8 7 6 5 4 9 3 2 0 180 80 20 160 90 150 170 100 110 1 This screen will disappear in 3 minutes. Seconds Remaining.
The scientist was trying to test the hypothesis:A plant needs light to grow.The experiment helps the scientist test the hypothesis because there are two plants that started out the same. The scientist placed one plant in the sun and the other in the shade to test the hypothesis while keeping the other variables constant in the experiment. This design limits the variation between the plants to the amount of light received by each plant.
Stephanie notices that after she swims her breathing is faster than it was when she was sitting by the pool. She thinks that the number of laps that she swims affects how fast she breathes.– Develop a hypothesis that Stephanie could use to test her idea.– Describe an experiment she could use to test her hypothesis.– Identify ONE independent variable and ONE dependent variable in her experiment. 130 120 60 70 30 50 40 10 140 8 7 6 5 4 9 3 2 0 180 80 20 160 90 150 170 100 110 1 Seconds Remaining. This screen will disappear in 3 minutes.
Hypothesis: The rate of breathing increases based on the number of laps Stephanie swims. If the number of laps increases, then the breathing rate will increase. Experiment: Stephanie can find out how many breaths she takes per minute while resting. She can then swim 5 laps and count the number of breaths she takes per minute. Stephanie can then rest until her breathing is back to a normal resting amount and swim 10 laps and count the number of breaths she takes per minute. She can continue these steps for up to 30 laps. During each test, Stephanie should swim at the same speed.Independent variable: number of laps Stephanie swimsDependent variable: breathing rate per set of laps
In 1648, a Flemish alchemist, Jan van Helmont, had a theory. To test it, he grew a tree in a tub of soil, adding nothing but measured quantities of water for five years. During that time he kept track of the weigh of the soil and the tree. At the end of the experiment the tree had gained 164 pounds and the soil had lost 2 ounces. What could von Helmont conclude from his experiment? 60 140 130 120 40 50 30 10 70 8 7 6 5 9 4 3 2 0 180 80 20 90 160 150 170 100 110 1 Seconds Left
Most of the tree’s increase came from something other than the soil
A student needs to heat a beaker of water on a hot plate.– Identify a safety precaution the student should take before plugging in the hot plate.– Explain why the safety precaution is necessary. 130 120 60 70 30 50 40 10 140 8 7 6 5 4 9 3 2 0 180 80 20 160 90 150 170 100 110 1 This screen will disappear in 3 minutes. Seconds Remaining.
The electrical cord of the hot plate should be checked before plugging in the hot plate because a frayed cord could lead to an electric shock.
A team of three students obtains a set of test tubes from the teacher. Each test tube contains a different colored powder. The students dissolve the powders in water without labeling the test tubes. The students then realize that they have forgotten which test tube is which. Each student suggests a solution to the problem. Describe a safety hazard for each of the student's solutions described in the table. 130 120 60 70 30 50 40 10 140 8 7 6 5 4 9 3 2 0 180 80 20 160 90 150 170 100 110 1 This screen will disappear in 3 minutes. Seconds Remaining.
All of the solutions from the students are potentially dangerous. Amanda wants to taste each solution. Because the powders were unknown, she can't tell whether the liquids are poisonous. Tasting the liquids could make the students sick. Kai wants to try mixing chemicals with the liquids to test their reactions. Because she doesn't know what the chemicals are, Kai can't be sure what the reactions will be. The reactions could be explosive or release toxic fumes. Damon wants to get a Bunsen burner and boil each liquid. Because he doesn't know what the liquids are, Damon can't predict how they will react to being heated. He can't tell whether the liquids are flammable. To solve their problem, the students should let the teacher know what happened and see if there is a safe way to figure out which liquid is which. If not, they may need to repeat the experiment.
A student needs to buy sunscreen for a trip to a local water park. The store had the two brands shown below. The student wanted to decide which sunscreen would be the best to use. – Name two misleading statements on one of the labels. – Explain why the statements you selected are misleading. 130 120 60 70 30 50 40 10 140 8 7 6 5 4 9 3 2 0 180 80 20 160 90 150 170 100 110 1 This screen will disappear in 3 minutes. Seconds Remaining.
Brand one is misleading because it says that it is water resistant, but if you have to reapply it after swimming and sweating, it is not waterproof under the conditions most users would use it for. It is also misleading because it says it is pediatrician tested, but it does not say what the results of the test were. It might have been tested and found to be inferior to all of the other brands that were tested.
To find the mass of some iron filings, a student places the filings in a 14-gram plastic tray and places the tray on a balance. –What is the reading on the balance for the mass of the tray and iron filings?–What is the mass of the iron filings? 130 120 60 70 30 50 40 10 140 8 7 6 5 4 9 3 2 0 180 80 20 160 90 150 170 100 110 1 This screen will disappear in 3 minutes. Seconds Remaining.
The balance reading is 352 grams. Because the tray has a mass of 14 grams, the mass of the iron filings is 338 grams.
A student added some water to a graduated cylinder. This initial volume is shown in the graduated cylinder on the left. Then, the student placed a small rock in the cylinder, as shown in the graduated cylinder on the right.–What was the volume of water that the student initially added to the cylinder?–What is the volume of the rock?–Describe two characteristics of the rock that can be observed without touching the rock or using any tools. 130 120 60 70 30 50 40 10 140 8 7 6 5 4 9 3 2 0 180 80 20 160 90 150 170 100 110 1 Seconds You have this much time left:
The volume of the water is 35 mL. The volume of the rock is 17 mL.One characteristic of the rock that can be observed is its small size. It must be small to fit into a graduated cylinder. Also, the rock has different minerals in it. You can see them in the light and dark patches on the rock's surface.
Students grow two groups of plants. Ten plants are given fertilizer, and 10 plants are grown without fertilizer. They measure the height of each plant every other day and find the average height for each group. The table below shows their data. The students want to make a graph of this data to learn about the effect of fertilizer on plant growth.– Explain which type of graph the students should make.– Graph the data set onto a single graph. Be sure to title and label your graph. 130 120 60 70 30 50 40 10 140 8 7 6 5 4 9 3 2 0 180 80 20 160 90 150 170 100 110 1 This screen will disappear in 3 minutes. Seconds Remaining.
A double line graph is best for this data because the students are working with two groups of plants and want to show how each group changes over time.
Determine the density of the rock shown in the figure. Explain how you determined your answer and use appropriate units of measurement. 130 120 60 70 30 50 40 10 140 8 7 6 5 4 9 3 2 0 180 80 20 160 90 150 170 100 110 1 You have this much time left: Seconds
The density of the rock is 4 g/mL. I determined the density by dividing the mass of the rock by the volume of water that it displaced in the graduated cylinder. A ruler could not be used to find the volume because the rock has an odd shape.
A student is planning an experiment to learn about the specific heat capacity of iron, copper, and aluminum. The student plans to follow the steps below.1. Heat each metal in an oven.2. Add each metal to an insulated container of water.3. Use a thermometer to observe water temperature changing.4. Record the highest water temperature.5. Compare the highest water temperature for each metal. The metal that leads to the highest temperature will have the highest specific heat capacity.For this experiment to work, the student must control several variables.–Choose two variables that must be controlled in this experiment, and explain the importance of controlling each variable. 130 120 60 70 30 50 40 10 140 8 7 6 5 4 9 3 2 0 180 80 20 160 90 150 170 100 110 1 This screen will disappear in 3 minutes. Seconds Remaining.
One variable that must be controlled is the mass of each metal used in the experiment. The student must use equal masses of iron, copper, and aluminum. This is because a larger mass can hold more heat. This means it would have more heat to transfer to water. Another variable to control is the temperature to which each metal is heated. If a metal were heated to a higher temperature, it would have more heat to transfer to the water.
A student used a ruler to find the dimensions of a box.The student recorded the box's length as 42 mm.– Explain why the student's measurement is incorrect and give the correct length. 130 120 60 70 30 50 40 10 140 8 7 6 5 4 9 3 2 0 180 80 20 160 90 150 170 100 110 1 You have this much time left: Seconds
The student used 42 mm as the measurement and didn't take into account that the block didn't start on the 0 mm mark. The actual block length is 29 mm.
A student thinks that increasing the concentration of salt in a saltwater solution will increase the boiling point of the solution. The student makes five saltwater solutions, each with a different concentration of salt. The student uses the same hot plate to heat each solution. The student uses the same thermometer to record the temperature of each solution when it begins to boil.– Identify the dependent and independent variables in this experiment. 130 120 60 70 30 50 40 10 140 8 7 6 5 4 9 3 2 0 180 20 160 90 150 170 1 100 110 80 Seconds You have this much time remaining:
In this experiment, the concentration of salt in each solution is the independent variable. This is the variable that the student changes deliberately in each sample. The boiling point of each solution is the dependent variable. This is the variable that the student hopes to change by varying the independent variable.
A group of students is planning a garden of tomato plants. They want to grow plants that have as many tomatoes as possible. There are three different fertilizers they can use in their garden.– Design a simple experiment the students could do to identify the fertilizer they should use. Include all the elements for a fair, scientific test in your answer. 130 120 60 70 30 50 40 10 140 8 7 6 5 4 9 3 2 0 180 80 20 160 90 150 170 100 110 1 Seconds Time remaining:
The experiment should have 20 tomato plants—five tomato plants for each type of fertilizer, and 5 control plants to be grown without fertilizer. Over several months, each plant would be given the same amount of water, sunlight, and fertilizer (except the controls, which only get water and sunlight). To analyze their results, students should count the total number of tomatoes produced by each group of plants. Students should use the fertilizer used by the group of plants producing the most tomatoes. If the control group produces the most tomatoes, students should not use fertilizer in their garden.