180
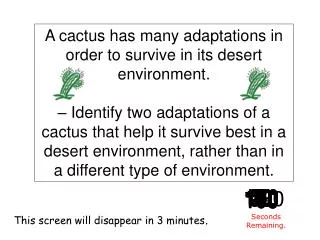
Plotting The Curve. Cumulative Frequency Table. ¾ . 70. Distance jumped (cm). Number of pupils. Cumulative Frequency. 60. ½. 180 d 190. 2. 2. 50. 190 d 200. 6. 8. 200 d 210. 9. 17. ¼. 40. Cumulative Frequency. 210 d 220. 7. 24.

180
E N D
Presentation Transcript
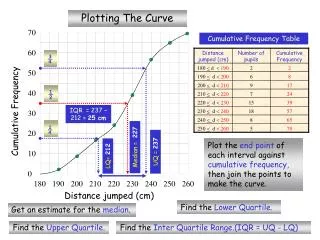
Plotting The Curve Cumulative Frequency Table ¾ 70 Distance jumped (cm) Number of pupils Cumulative Frequency 60 ½ 180 d 190 2 2 50 190 d 200 6 8 200 d 210 9 17 ¼ 40 Cumulative Frequency 210 d 220 7 24 Median = 227 30 220 d 230 15 39 UQ = 237 LQ= 212 230 d 240 18 57 20 240 d 250 8 65 250 d 260 5 70 10 0 180 190 200 210 220 230 240 250 260 Distance jumped (cm) IQR = 237 – 212 = 25 cm Plot the end point of each interval against cumulative frequency,then join the points to make the curve. Find the Lower Quartile. Get an estimate for the median. Find the Upper Quartile. Find the Inter Quartile Range.(IQR = UQ - LQ)
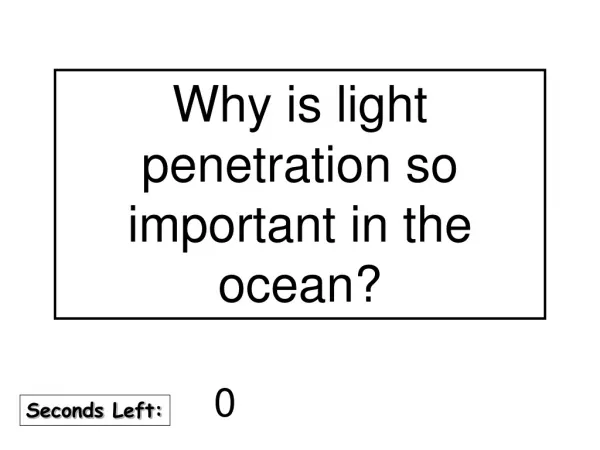
Interpreting Cumulative Frequency Curves 70 60 50 ¾ 40 Cumulative Frequency ½ 30 20 ¼ Median = 27 10 UQ =38 LQ = 21 0 40 50 20 30 60 70 10 Minutes Late The cumulative frequency curve gives information on aircraft arriving late at an airport. Use the curve to find estimates to (a) The median (b) The inter-quartile range (c) The number of aircraft arriving less than 45 minutes late. (d) The number of aircraft arriving more than 25 minutes late. IQR = 38 – 21 = 17 mins
70 60 50 ¾ 40 Cumulative Frequency ½ IQR = 38 – 21 = 17 mins 30 20 ¼ Median = 27 10 UQ = 38 LQ = 21 0 40 50 20 30 60 70 10 Minutes Late 20 0 10 30 40 50 60 Box Plot from Cumulative Frequency Curve
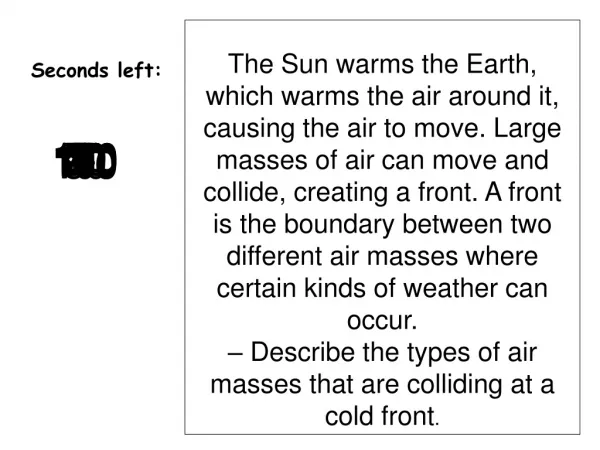
Example 70 60 50 Distance jumped (cm) Number of pupils Cumulative Frequency 40 Cumulative Frequency 180 d 190 2 30 190 d 200 6 200 d 210 9 20 210 d 220 7 220 d 230 15 10 230 d 240 18 240 d 250 8 0 180 190 200 210 220 230 240 250 260 250 d 260 5 Distance jumped (cm)