Download
1 / 7
70 likes | 172 Vues
Learn to integrate Google Maps into your website in just 5 minutes! This guide walks you through obtaining a Google Maps API Key, displaying a simple "Hello World" map, and adding custom markers using latitude and longitude coordinates. You can enhance your map further by incorporating controls for zooming and panning. For bulk point plotting, discover how to use specially formatted XML files to display multiple data points seamlessly. Perfect for developers looking for a straightforward way to visualize data on maps.

E N D
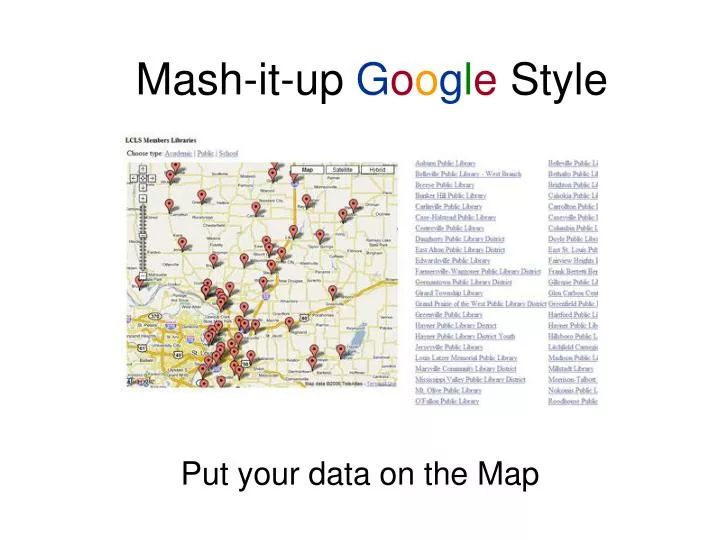
Mash-it-up Google Style Put your data on the Map
Google Maps • One of the easiest APIs to use. In 5 minutes you can have a simple map on your site. • First step – Get a Google Maps API Key: http://www.google.com/apis/maps/
The 5 Minute GMap • Get the “Hello World” example: http://www.google.com/apis/maps/documentation/#The_Hello_World_of_Google_Maps • Copy that text into a new HTML file. Add your key (Replace ‘key=abcdefg’, with ‘key=the big long key from Google’) • Lets add some controls (zoom/pan): map.addControl(new GSmallMapControl()); map.addControl(new GMapTypeControl());
Add markers to the map • We need a Lat/Long coordinate in the format: XX.XXXXXX, -YY.YYYYYY(ex. 36.601145,-121.894684 – Portola Plaza) • Create a new point:var point = new GLatLng(36.601145,-121.894684); • Add it to the map!map.addOverlay(new GMarker(point)); • Save your work and view it in your browser of choice!
All your data are belong on Google Maps • For plotting many points, Google has included a way to import specially formatted XML files. With a simple loop all your points will be plotted to the map!http://www.google.com/apis/maps/documentation/#Using_XML_and_Asynchronous_RPC • Sample format: <markers> <marker lat="37.427770" lng="-122.144841"/> <marker lat="37.413320" lng="-122.125604"/> <marker lat="37.433480" lng="-122.139062"/> <marker lat="37.445427" lng="-122.162307"/> </markers>
Plotting Dynamic Data • LCLS delivery routes are stored in a MySQL database. • Using ASP.NET and a custom API, the routes are outputted into an XML formatted document which is loaded into the Google Map API:http://www.lcls.org/api/query/?method=lcls.members.getDeliveryRoute&routeid=1&day=friday
Questions? Seldom updated blog: http://cdeweese.blogspot.comEmail: chris.deweese@gmail.com