Download
1 / 75
750 likes | 901 Vues
Trends in the epidemic over time. UNAIDS/WHO Working Group on Global HIV/AIDS and STI Surveillance. A global view of HIV infection 33 million adults living with HIV/AIDS as of end 1999. Adult prevalence rate. 15.0% – 36.0% 5.0% – 15.0% 1.0% – 5.0% 0.5% – 1.0% 0.1% – 0.5%

E N D
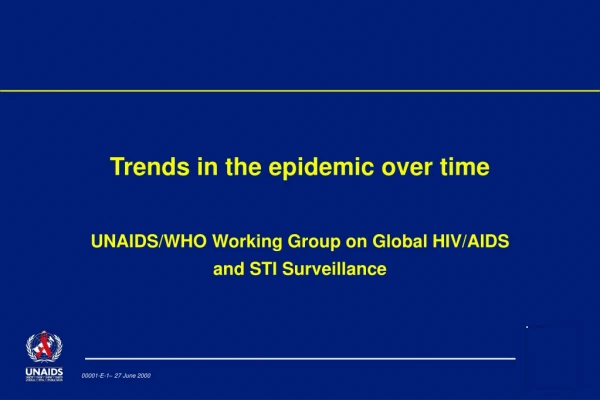
Trends in the epidemic over time UNAIDS/WHO Working Group on Global HIV/AIDS and STI Surveillance
A global view of HIV infection33 million adults living with HIV/AIDS as of end 1999 Adult prevalence rate 15.0% – 36.0% 5.0% – 15.0% 1.0% – 5.0% 0.5% – 1.0% 0.1% – 0.5% 0.0% – 0.1% not available
Spread of HIV over time in Latin America and the Caribbean, 1984 to 1999 Estimated percentage of adults (15–49) infected with HIV 2.0% – 6.0% 1.0% – 2.0% 0.5% – 1.0% 0.1% – 0.5% 0.0% – 0.1% trend data unavailable outside region
Spread of HIV over timein sub-Saharan Africa, 1984 to 1999 Estimated percentage of adults (15–49) infected with HIV 20.0% – 36.0% 10.0% – 20.0% 5.0% – 10.0% 1.0% – 5.0% 0.0% – 1.0% trend data unavailable outside region
Spread of HIV over time in Asia, 1984 to 1999 2.0% – 5.0% 1.0% – 2.0% 0.5% – 1.0% 0.1% – 0.5% 0.0% – 0.1% trend data unavailable outside region
4,000,000 3,500,000 3,000,000 Highly industrialized countries 2,500,000 North Africa & Middle East Eastern Europe & Central asia 2,000,000 Sub-Saharan Africa Latin America & the Caribbean 1,500,000 Southern & Eastern Asia 1,000,000 500,000 - 80 81 82 83 84 85 86 87 88 89 90 91 92 93 94 95 96 97 98 99 Estimated annual number of new HIV infections by region, 1980 to 1999 New infections
25,000,000 20,000,000 Highly industrialized countries North Africa & Middle East 15,000,000 Eastern Europe & Central Asia Sub-Saharan Africa Latin America & the Caribbean 10,000,000 Southern & Eastern Asia 5,000,000 80 81 82 83 84 85 86 87 88 89 90 91 92 93 94 95 96 97 98 99 Estimated number of people living with HIV/AIDS by region, 1980 to 1999 People living with HIV/AIDS
Number of diagnosed HIV infections, Ukraine, 1993 to 1998 1993 1994 1995 1996 1997 1998 5,000 10,000 15,000 20,000 25,000 30,000 Source: National AIDS Programme, Ukraine, 1999
Annual number of newly registered HIV infections, Russia, 1993 to 1999 18,000 15,462 16,000 14,000 12,000 10,000 8,000 Number of HIV infections 6,000 4,399 3,947 4,000 1,546 2,000 196 108 158 0 93 94 95 96 97 98 99 Year of registration Source: Russian Federal AIDS Centre, Moscow
The epidemic in sub-Saharan Africa UNAIDS/WHO Working Group on Global HIV/AIDS and STI Surveillance
35 30 25 20 15 10 5 0 85 86 87 88 89 90 91 92 93 94 95 96 97 98 Median HIV prevalence among pregnant women in urban areas in Uganda, 1985 to 1998 HIV prevalence (%) Source: STD/AIDS Control Programme, Uganda
HIV prevalence among pregnant women in Botswana, 1998 50 40 30 HIV prevalence (%) 20 10 0 15-19 20-24 25-29 30-34 35-39 40-44 Age Groups Source: Ministry of Health, Botswana
HIV prevalence among pregnant womenin South Africa, 1990 to 1999 25 22.8 22.4 20 17 14.2 15 HIV prevalence (%) 10.4 10 7.6 5 4 2.1 1.7 0.7 0 90 91 92 93 94 95 96 97 98 99 Source: Department of Health, South Africa
Estimated adult HIV prevalence in Kenya, 1990-1999 16 14 12 10 HIV prevalence (%) 8 6 4 2 0 90 91 92 93 94 95 96 97 98 99 Source: National AIDS and STD Control Programme, 1999 and UNAIDS
The impact of the epidemic on youth UNAIDS/WHO Working Group on Global HIV/AIDS and STI Surveillance
HIV prevalence rate among 13 to 19-year-olds, Masaka, Uganda, 1989 to 1997 5 girls 4 boys 3 HIV prevalence (%) 2 1 0 1989/90 1990/91 1991/92 1992/93 1993/94 1994/95 1995/96 1996/97 Source: Kamali et al. AIDS 2000, 14: 427-434
HIV prevalence rate among pregnant 15 to 19-year-olds, Lusaka, Zambia, 1993 to 1998 35 30 25 1993 20 HIV prevalence (%) 1994 1998 15 10 5 0 Chelstone Chilenje Kalingalinga Matero Clinic Source: Ministry of Health, Zambia, 1999
30 illiterate primary education 25 secondary education 20 HIV prevalence (%) 15 10 5 0 1991-1994 1995-1997 HIV prevalence rate among pregnant 15-24 year-olds by educational status, Uganda Source: Kilian A et al. AIDS 1999, 13: 391-398.
HIV prevalence rate among teenagers in Kisumu, Kenya, by age 35 33.3 29.4 30 25 22 HIV prevalence (%) 20 17.9 boys girls 15 8.6 10 8.3 3.6 5 2.2 0 0 0 15 16 17 18 19 Age in years Source: National AIDS Programme, Kenya, and Population Council, 1999
HIV prevalence rate among women in their teens and early twenties, various African studies, 1995-1998 70 women, 15-19 60 women, 20-24 50 40 HIV prevalence (%) 30 20 10 0 Carletonville, South Africa, 1998 (urban) Mutasa district, Zimbabwe, 1998 (rural) Ndola, Zambia 1997 (urban) Mposhi, Zambia, 1996 (rural) Masaka, Uganda 1996 (rural) Kisumu, Kenya, 1997 (urban) Cotonou, Benin 1997 (urban) Kisesa, Tanzania, 1997 (rural) Lusaka, Zambia, 1995 (urban) Fort Portal, Uganda 1995 (urban) Yaounde, Cameroon 1997 (urban)
Proportion of children testing HIV-positive at a sexual abuse clinic, Harare, Zimbabwe, 1998-1999 13-16 tested HIV-positive on arrival 9-12 observed to seroconvert after abuse Age group (years) 5-8 0-4 0 2 4 6 8 10 12 14 HIV-infected (%) Source: Family Support Trust, Zimbabwe, 1999.
The impact of the epidemic on other populations and groups UNAIDS/WHO Working Group on Global HIV/AIDS and STI Surveillance
HIV prevalence among people consuming alcohol and among non-drinkers, Carletonville, South Africa, 1998 70 drinkers 60 non-drinkers 50 HIV prevalence (%) 40 30 20 10 0 men women women in commercial sex areas Source: Campbell et al. (unpublished data)
HIV prevalence rate and frequency of sexually transmitted infection (STI) episodes, Carletonville miners, South Africa, 1991-1998 90 80 70 60 HIV prevalence (%) 50 40 30 20 10 0 1 2-4 5-9 10+ Number of STI episodes Source: Ballard R, 2000 (unpublished data).
HIV prevalence in military personnel in Africa • Nigeria: 11% among peacekeepers returning from Sierra Leone and Liberia vs 5% in adult population • South Africa: 60-70% in military vs 20% in adult population Source: Nigeria AIDS bulletin No 15, May 20, 2000; The Mail & Guardian, Pretoria, March 31, 2000; UNAIDS/WHO 1999 estimate
The demographic impact of the epidemic UNAIDS/WHO Working Group on Global HIV/AIDS and STI Surveillance
Projected population structure with and without the AIDS epidemic, Botswana, 2020 80 Projected population structure in 2020 75 70 Males Females Deficits due to AIDS 65 60 55 50 Age in years 45 40 35 30 25 20 15 10 5 0 140 120 100 80 60 40 20 0 0 20 40 60 80 100 120 140 Population (thousands) Source: US Census Bureau, World Population Profile 2000
Increase in mortality among men between 15 and 60, selected African countries, 1986-1997 80 estimated for 6 years before survey estimated for year of survey 70 60 50 Probability of dying from all causes 40 30 20 10 0 Tanzania, 1996 Malawi, 1992 Zimbabwe, 1994 Uganda, 1995 Zambia, 1996-97 Source: Timaeus I, AIDS 1998, 12 (suppl): S15-S27
Adult mortality attributable to HIV, community-based studies in Africa, 1990-1996 Mortality among HIV-negatives Mwanza, Tanzania (4% HIV) Excess mortality due to HIV Kisesa, Tanzania (7% HIV) Masaka, Uganda (8% HIV) Rakai, Uganda (21% HIV) 0 5 10 15 20 25 30 35 40 Mortality per 1,000 person - years Source: Boerma JT et al, AIDS 1998, 12 (suppl 1): S3-S14
Trends in mortality among children under five years old and end-1999 adult HIV prevalence rate, selected African countries, 1981-1996 110 % Zambia 105 % HIV prevalence 19.9% 100 % Relative under-5 mortality (1981 = 100%) 95 % Kenya HIV prevalence 14.1% 90 % Cameroon 85 % HIV prevalence 7.7% 80 % 80 82 84 86 88 90 92 94 96 98 Source: Demographic and Health Surveys, Macro International, USA
Probability of a Zimbabwean boy aged 15 dying before age 50, trends over time, various national surveys 60 55 reports from surviving siblings 50 death registration 45 household reports of death 40 35 Probability of dying before age 50 (%) 30 25 20 15 10 5 0 1980 1985 1990 1995 2000 Source: Feeney G, 1999 (unpublished data).
Estimated impact of AIDS on under-5 child mortality rates, selected African countries, 2010 250 Deaths per 1000 live births 200 WithoutAIDS WithAIDS 150 100 50 0 Botswana Kenya Malawi Tanzania Zambia Zimbabwe Source: US Census Bureau
Changes in life expectancy in selected African countries with high HIV prevalence, 1950 to 2000 65 60 Botswana Uganda 55 South-Africa Life expectancy at birth, in years Zambia 50 Zimbabwe 45 40 35 1950-55 1955-60 1960-65 1965-70 1970-75 1975-80 1980-85 1985-90 1990-95 1995-00 Source: United Nations Population Division, 1998
Predicted loss in life expectancy due to HIV/AIDS in children born in 2000 Predicted life expectancy Loss in life expectancy due to HIV/AIDS Botswana Zimbabwe South Africa Kenya Zambia Côte d'Ivoire Rwanda Mozambique Haiti Cambodia 0 10 20 30 40 50 60 70 Life expectancy at birth (years) Source: U.S. Census Bureau, 2000
Lifetime risk of AIDS death for 15-year-old boys, assuming unchanged or halved risk of becoming infected with HIV, selected countries 100% 90% Botswana 80% Zimbabwe 70% Botswana South Africa Risk of dying of AIDS Zambia 60% Zimbabwe 50% Kenya South Africa risk halved over next 15 years Zambia Côte d’Ivoire 40% current level of risk maintained Cambodia Kenya 30% Côte d’Ivoire Burkina Faso 20% Cambodia Burkina Faso 10% 0% 0% 5% 10% 15% 20% 25% 30% 35% 40% Current adult HIV prevalence rate Source: Zaba B, 2000 (unpublished data)
Leading causes of death in Africa, 1999 Rank % of total • 1 HIV/AIDS • 2 Acute lower respiratory infections • 3 Malaria • 4 Diarrhoeal diseases • 5 Perinatal conditions • 6 Measles • 7 Tuberculosis • 8 Cerebrovascular disease • 9 Ischaemic heart disease • 10 Maternal conditions 20.6 10.3 9.1 7.3 5.9 4.9 3.4 3.2 3.0 2.4 Source: The World Health Report 2000, WHO
Leading causes of death globally, 1999 Rank % of total 12.7 9.9 7.1 4.8 4.8 4.2 4.0 3.0 1.9 • 1 Ischaemic heart disease • 2 Cerebrovascular disease • 3 Acute lower respiratory infections • 4 HIV/AIDS • 5 Chronic obstructive pulmonary disease • 6 Perinatal conditions • 7 Diarrhoeal diseases • 8 Tuberculosis • 11 Malaria Source: The World Health Report 2000, WHO
Leading causes of disease burden in Africa, 1999 Rank % of total • 1 HIV/AIDS • 2 Malaria • 3 Acute lower respiratory infections • 4 Diarrhoeal diseases • 5 Perinatal conditions • 6 Measles • 7 Maternal conditions • 8 Tuberculosis • 9 Congenital abnormalities • 10 Road traffic accidents 19.9 9.9 8.5 6.5 6.5 4.7 3.4 2.3 1.7 1.7 Source: The World Health Report 2000, WHO
Leading causes of disease burden globally, 1999 Rank % of total 6.7 6.2 6.2 5.0 4.1 4.1 3.5 3.1 2.3 • 1 Acute lower respiratory infections • 2 HIV/AIDS • 3 Perinatal conditions • 4 Diarrhoeal diseases • 5 Ischaemic heart disease • 6 Unipolar major depression • 7 Cerebrovascular disease • 8 Malaria • 12 Tuberculosis Source: The World Health Report 2000, WHO
The economic impact of the epidemic UNAIDS/WHO Working Group on Global HIV/AIDS and STI Surveillance
Newly diagnosed AIDS cases and medical expenditure on an agricultural estate in Kenya, 1989 to 1997 120 25 new AIDS cases medical spending 100 20 80 Medical expenditure (KSh millions) 15 Number of newly diagnosed AIDS cases 60 10 40 5 20 0 0 89 90 91 92 93 94 95 96 97 Source: Rugalema et al. HIV/AIDS and the commercial agricultural sector of Ken UNDP/FAO, 1999
Impact of HIV/AIDS on urban households, Côte d’Ivoire General population Families living with AIDS 30 000 Francs CFA 25 000 Monthly income per capita 20 000 15 000 Monthly consumption per capita 10 000 5 000 Savings/Disavings 0 – 5 000 Source: Simulation-based on data from Bechu, Delcroix and Guillaume, 1997
Reduction in production in a household with an AIDS death, Zimbabwe Reduction in output 61% 47% 49% 37% 29% Crops • Maize • Cotton • Vegetables • Groundnuts • Cattle owned Source: Stover & Bollinger, 1999
Factors that determine the spread of the epidemic: Knowledge and behaviour UNAIDS/WHO Working Group on Global HIV/AIDS and STI Surveillance
Percentage of 15-19 girls who do not know that a HIV-infected person may look healthy, 1994-1999 100 90 83 81 80 80 73 68 67 66 66 70 62 62 57 56 60 54 51 50 47 47 Percentage who do not know 50 45 45 41 40 39 39 37 40 35 33 32 31 31 28 26 30 23 22 20 14 10 0 Haiti Mali Peru Chad Togo Niger Nepal Brazil Benin Kenya Eritrea Turkey Lesoto Malawi Uganda Zambia Tanzania Comoros Mongolia Viet Nam Romania Cambodia Cameroon Guatemala Zimbabwe Bangladesh Cape Verde Madagascar Côte d'Ivoire Mozambique South Africa Papua New Guinea Dominican Republic Central African Republic Sources: UNICEF, DHS surveys and other nationwide surveys, 1994-99.
100% 75% 50% 25% 0% Mali Peru Haiti Niger Kenya Brazil Bolivia Uganda Chad Malawi Zambia Tanzania Zimbabwe Nicaragua Mozambique Dominican Republic Knowledge of condoms among adolescent boys Do not know condoms Know condoms but not where to get them Percentage of 15-19 year old boys Know condoms and where to get them Sources: UNICEF, DHS surveys, 1994-1999
Dominican Rep. 96% Zimbabwe 92% Zambia 88% Uganda 85% Kenya 85% South Africa 84% Peru 79% Haiti 74% Tanzania 73% CAR 70% Cote d'Ivoire 66% Cameroon 65% Benin 62% Madagascar 58% Mali 41% Chad 36% Niger 26% 0% 70% 80% 20% 40% 60% 10% 30% 50% 90% 100% Percentage of 15-49 year old women who are aware that HIV can be transmitted from a mother to her child, 1994-1999 Sources: UNICEF, DHS and other nationwide surveys, 1994-1999
Nicaragua Nepal Colombia Bolivia Guatemala Brazil Dominican Rep. Niger Benin Chad Mali Cameroon Togo Haiti CAR Kenya Uganda Zambia Zimbabwe Risk perception percentage of sexually active women (15-19) that perceive not to be at risk at all of getting AIDS 0% 68% 0% 93% 1% 58% 1% 54% 1% 87% 1% 52% 1% 76% 1% 87% 2% 54% 2% 60% 3% HIV Prevalence (at time of survey *) 46% 6% 43% 7% Percentage of 15-19 year old girls who think they are not at risk of AIDS 45% 10% 63% 10% 41% 16% 36% 19% 21% 27% 52% 30% 50% 0% 100% 20% 60% 90% 10% 30% 50% 80% 40% 70% *HIV prevalence in women attending antenatal care clinics in major urban areas Sources: UNICEF, DHS surveys, 1994-1999
Knowledge and beliefs concerning AIDS among AIDS orphans, Rusinga Island, Kenya 99.6 100 90 80 70 60 Orphans holding the belief (%) 50 39.3 40 30 18.3 20 10 0 0 Believe many people in their community have died of AIDS Believe people in extended family died of AIDS Know about AIDS Believe parents died of AIDS Source: Johnston T et al. Population Communication Africa, Kenya, 1999
60 casual sex in the past year condom use at last casual sex 50 40 Respondents reporting the behaviour (%) 30 20 10 0 0-2 3-6 7-9 10+ Number of years respondent spent in school Casual sex and condom use by educational status, Mozambique Source: Agha S, et al. The promotion of safer sex among high-risk individuals in Mozambique, Population Services International, USA, 1999