Download
1 / 32
320 likes | 495 Vues
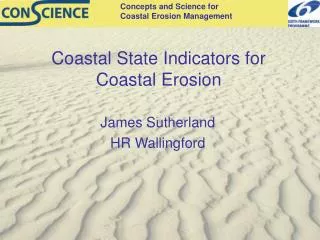
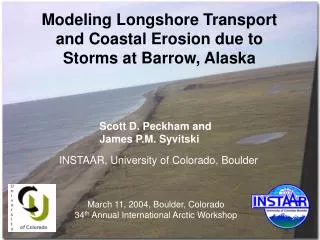
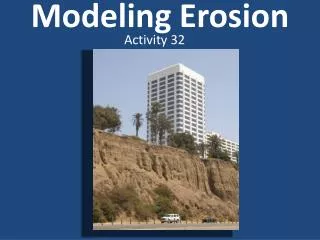
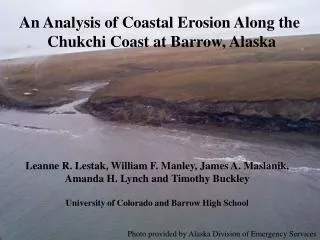
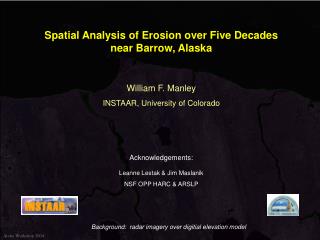
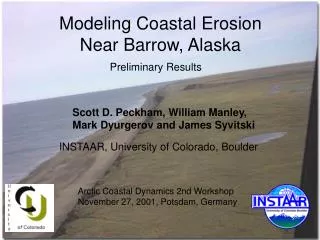
Modeling Coastal Erosion Near Barrow, Alaska. Preliminary Results. Scott D. Peckham, William Manley, Mark Dyurgerov and James Syvitski. INSTAAR, University of Colorado, Boulder. Arctic Coastal Dynamics 2nd Workshop November 27, 2001, Potsdam, Germany.

E N D
Modeling Coastal Erosion Near Barrow, Alaska Preliminary Results Scott D. Peckham, William Manley, Mark Dyurgerov and James Syvitski INSTAAR, University of Colorado, Boulder Arctic Coastal Dynamics 2nd Workshop November 27, 2001, Potsdam, Germany
This coastal erosion modeling project is part of a larger NSF Arctic System Science (ARCSS) Program project entitled: An Integrated Assessment of the Impacts of Climate Variability on the Alaskan North Slope Coastal Region Principal Investigators: Amanda Lynch, Ronald Brunner, Judith Curry, James Maslanik, Linda Mearns, Anne Jensen, Glenn Sheehan and James Syvitski It is also part of HARC: Human Dimensions of the Arctic
Preliminary DEM based on 1955 Barrow B-4 USGS topo map. (William Manley & Leanne Lestak)
storm wind Locations of key features near Barrow, Alaska.
Delft3D is a fully-coupled suite of models: FLOW, WAVE, SED, MOR, WAQ & PART
The Main Modules of Delft3D FLOW: Module to solve for 3D hydrodynamic flow field subject to prescribed initial & boundary conditions on a grid. SED: Module to model suspended sediment transport. MOR: Module to track changes to bed morphology as a result of flow-driven bed and suspended sediment transport. WAVE: Module to simulate nearshore waves (SWAN) that result from prescribed wind and bed roughness data. QUICKIN: Utility for importing & manipulating bathymetric data. RGFGRID: Utility for creating & editing the orthogonal, curvilinear grids that are used by the FLOW and WAVE modules. GPP: Utility for post-processing and visualization.
Preliminary DEM with Bathymetry for Barrow, AK and Vicinity.
Example of an Orthogonal Computational Grid for the Flow and Sediment Transport Modeling
Other Examples of Computational Grids Hong Kong North Sea
Summary of Big Storms Near Barrow October 3-5, 1963 Ice-free conditions near Barrow. $3 million (1963 dollars) in reported damage. Winds from due west. Average, Sustained (1-min) and Peak wind speeds of 39, 55 and 75 mph. Estimated sediment transport of 200,000 cubic yards. Estimated wave heights of 10 ft; storm surge of 11 to 12 ft. Salt-water contamination of Fresh Lake (NARL water supply) (See Hume and Schalk (1967) for more details.) NOTE: The prevailing wind direction for Barrow is from E to ENE, with typical speeds of 11 to 12 mph. Normal daily tide is 6 inches. August 10, 2000 Ice-free conditions near Barrow. $7 million in reported damage. Winds from due west. Average, Sustained (1-min) and Peak wind speeds of 37, 55 and 64 mph. Estimated wave heights of ???? Loss of dredge used for beach nourishment.
Observed Reduction in Sea-Ice Extent from 1979 to 1995 A reduction in sea-ice extent is expected to increase the likelihood of coastal erosion and damage from large storms. Even partial coverage inhibits the formation of large waves.
Base station (on top of the old theatre in the NARL complex) used for the differential GPS measurements. (William Manley & Mark Dyurgerov, 2001)
Using differential GPS to measure coastline position. (Credit: William Manley & Mark Dyurgerov)
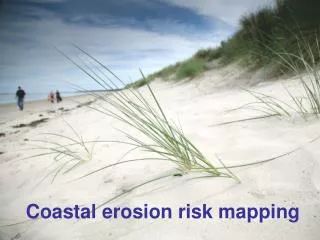
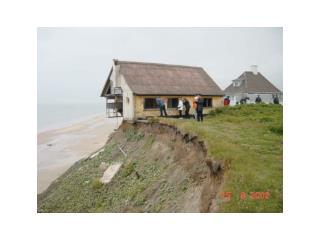
Differential GPS was also used to measure the current position of the bluffs and to collect data for high resolution DEMs of some bluff faces. (Credit: William Manley & Mark Dyurgerov, INSTAAR)
Conclusions Although we are still in the early stages of this work, it appears that Delft3D and associated modules will allow us to model sediment transport along the coast of Barrow, AK in response to large storms such as those observed in October of 1963 and August of 2000. This will allow us to quantify the cumulative effect of several such storms, and to explore various mitigation scenarios such as dredging and beach nourishment.
The Main Modules of Delft CHESS UNIBEST: Longshore & cross-shore sediment transport model for predicting shoreline evolution.