Download
1 / 25
250 likes | 461 Vues
The Future of Medicaid. Diane Rowland, Sc.D. Executive Vice President, Henry J. Kaiser Family Foundation and Executive Director, Kaiser Commission on Medicaid and the Uninsured for National Congress on Health Reform Washington, DC September 23, 2008. Medicaid Today.

E N D
The Future of Medicaid Diane Rowland, Sc.D. Executive Vice President, Henry J. Kaiser Family Foundation and Executive Director, Kaiser Commission on Medicaid and the Uninsured for National Congress on Health Reform Washington, DC September 23, 2008
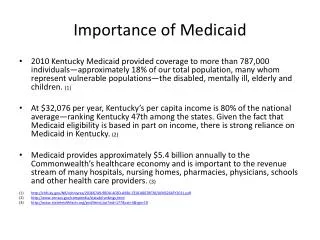
Medicaid Today Health Insurance Coverage 29 million children & 15 million adults in low-income families; 14 million elderly and persons with disabilities Assistance to Medicare Beneficiaries 8.8 million aged and disabled — 21% of Medicare beneficiaries Long-Term Care Assistance 1 million nursing home residents; 41% of long-term care services MEDICAID Support for Health Care System and Safety-net 16% of national spending on health services and supplies State Capacity for Health Coverage 43% of federal funds to states
Percent of Nonelderly Residents Covered by Medicaid, by State, 2005-2006 NH VT ME WA MT ND MN MA OR NY ID SD WI RI MI CT WY PA NJ IA NE OH NE IN NV DE IL WV UT VA MD CO KY CA KS MO NC DC TN OK SC AR AZ NM GA MS AL TX LA AK FL HI >15% (12 states including DC) 13-15% (17 states) US Average = 13% 10-12% (15 states) < 10% (7 states) SOURCE: Urban Institute and KCMU analysis of the March 2006 and 2007 Current Population Survey. Two-year pooled estimates for states and the US (2005-2006).
Medicaid’s Role for Selected Populations Percent with Medicaid Coverage: Families Aged & Disabled Note: “Poor” is defined as living below the federal poverty level, which was $17,600 for a family of 3 in 2008. SOURCE: KCMU, KFF, and Urban Institute estimates; Birth data: NGA, MCH Update.
Medicaid in the Health System, 2006 Medicaid as a share of national health care spending: Total National Spending (billions) $1,966 $648 $660 $125 $217 NOTE: Does not include spending on SCHIP SOURCE: A Catlin et al, “National Health Spending in 2006: A Year of Change for Prescription Drugs,” Health Affairs 27(1)14-29, January/February 2008. Based on National Health Care Expenditure Data, CMS, Office of the Actuary.
Medicaid Enrollees and Expendituresby Enrollment Group, 2005 Elderly 10% Elderly 28% Disabled 14% Adults 26% Disabled 42% Children 50% Adults 12% Children 18% Total = 59 million Total = $275 billion SOURCE: Kaiser Commission on Medicaid and the Uninsured and Urban Institute estimates based on 2005 MSIS data.
Medicaid Payments Per Enrolleeby Acute and Long-Term Care, 2005 $13,524 $11,839 $2,102 $1,617 SOURCE: Kaiser Commission on Medicaid and the Uninsured and Urban Institute estimates based on 2005 MSIS data.
Health Insurance Coverage of Children and Nonelderly Adults, 2006 Children Adults under 65 Total: 78.2 million Total: 181.8 million Note Medicaid also includes S-CHIP, other state programs, Medicare, and military-related coverage. SOURCE: KCMU and Urban Institute estimates based on March 2007 Current Population Survey.
Uninsured Rates Among the Low-Income Nonelderly 2005-2006 NH VT ME WA MT ND MN MA OR NY ID SD WI RI MI CT WY PA NJ IA NE OH NE NV IN DE IL WV UT VA MD CO KY CA KS MO NC DC TN OK SC AR AZ NM GA MS AL TX LA AK FL HI ≥ 34% (17 states) 28-33% (17 states) US Average = 33% < 28% (17 states including DC) SOURCE: Urban Institute and KCMU analysis of the March 2006 and March 2007 Current Population Survey. Two-year pooled estimates for states and the US (2005-2006).
Poor Poor Poor (<100% Poverty) Near-Poor Near-Poor Near-Poor (100-199% Poverty) Medicaid’s Role for Low-Income Adults and Children, 2006 Children Parents Adults without Children NOTE: Medicaid also includes SCHIP and other state programs, Medicare and military-related coverage. SOURCE: KCMU/Urban Institute analysis of March 2007 CPS.
Access to Employer-Based Coverage by Family Income, 2005 (Family Income <100% FPL) (Family Income 400%+ FPL) SOURCE: Garrett B. and Clemens-Cope. Changes in Employer-Sponsored Health Insurance Coverage: 2001-2005. Kaiser Commission on Medicaid and the Uninsured report. June 2006
Average Annual Premium Costs for Covered Workers, 2000 and 2007 $12,106 $6,438 $4,479 $2,471 Family Coverage Single Coverage Note: Family coverage is defined as health coverage for a family of four. Data represents average for all types of plans. SOURCE: Kaiser/HRET Survey of Employer-Sponsored Health Benefits, 2007.
Children’s Eligibility for Medicaid/SCHIP by Income, January 2008 NH VT WA ME MT ND MN MA OR NY ID SD WI RI MI CT WY PA NJ IA NE OH IN NV WV DE IL IL UT VA MD CO CA KS MO KY NC DC TN OK SC AR AZ NM AL GA MS TX LA AK FL HI < 200% FPL (9 states) U.S. Median Eligibility = 200% FPL 200% FPL (23 states) 201-250% FPL (8 states) 251-350% FPL (11 states including DC) *The Federal Poverty Line (FPL) for a family of 3 in 2008 is $17,600 per year. **IL and NY use state funds to cover children above 200% FPL. ***Since January 2008, SC, WI, and LA have implemented expansions. SOURCE: Based on a national survey conducted by the Center on Budget and Policy Priorities for KCMU, 2008.
Medicaid Eligibility for Working Parents by Income, January 2008 NH VT WA ME MT ND MN MA OR NY ID SD WI RI MI CT WY PA NJ IA NE OH IN NV DE IL IL WV UT VA MD CO CA KS MO KY NC DC TN OK SC AR AZ NM AL GA MS TX LA AK FL HI < 50% FPL (13 states) 50- 99% FPL (21 states) 100-150% FPL (8 states) US Median Eligibility = 63% FPL 151-275% FPL (9 states including DC) *The Federal Poverty Line (FPL) for a family of three in 2008 is $17,600 per year. ** Maryland plans to expand eligibility for parents to 116% FPL in 2008. SOURCE: Based on a national survey conducted by the Center on Budget and Policy Priorities for KCMU, 2008.
Children’s Access to Care, by Health Insurance Status, 2006 NOTE: MD contact includes MD or any health care professional, including time spent in a hospital. Data is for all children under age 18, except for dental visit and unmet dental need, which are for children age 2-17. Respondents who said usual source of care was the emergency room were included among those not having a usual source of care.All estimates are age-adjusted. SOURCE: KCMU analysis of National Center for Health Statistics, CDC. 2007. Summary of Health Statistics for U.S. Children: NHIS, 2006.
Barriers to Health Care Among Nonelderly Adults, by Insurance Status, 2006 Percent of adults (age 19 – 64) reporting in past 12 months: NOTE: Respondents who said usual source of care was the emergency room were included among those not having a usual source of care. SOURCE: KCMU analysis of 2006 NHIS data.
Medicaid Enrollees are Poorer and Sicker Than The Low-Income Privately Insured Population Percent of Enrolled Adults: Low-Income and Privately Insured Medicaid Poor Health Conditions that limit work Fair or Poor Health SOURCE: Coughlin et. al, “Assessing Access to Care Under Medicaid: Evidence for the National and Thirteen States,” Health Affairs 24(4):1073-1083. Based on a 2002 NSAF analysis for Kaiser Commission on Medicaid and the Uninsured.
Per Capita Spending For Medicaid Enrollees vs.Low-Income Privately-Insured Samples adjusted for health differences Adults Children SOURCE: Hadley and Holahan, “Is Health Care Spending Higher under Medicaid or Private Insurance? “ Inquiry, Winter 2003/2004.
Medicaid Financing of Safety-Net Providers Public Hospital Net Revenues by Payer, 2004 Health Center Revenues by Payer, 2006 Total = $29 billion Total = $8.1 billion SOURCE: America’s Public Hospitals and Health Systems,2004, National Association of Public Hospitals and Health Systems, October 2006. KCMU Analysis of 2006 UDS Data from HRSA.
Medicaid as a Building Block for Health Reform • The basis for affordable coverage for low-income families • Key source of financing • Serves key roles outside larger health reform including: • Financing long-term services and supports • Serving and managing complex populations • Supporting safety net providers • Emergency services for immigrants
Federal Medical Assistance Percentages (FMAP), FY 2008 NH VT WA ME MT ND MN MA OR NY ID SD WI RI MI CT WY PA NJ IA NE OH IN NV WV DE IL IL UT VA VA CO MD CA KS MO KY NC DC TN OK SC AR AZ NM AL GA MS TX LA AK FL HI 71+ percent (6 states) 62 to <71 percent (16 states including DC) 51 to <61 percent (16 states) 50 percent (13 states) SOURCE: Federal Register, November 30, 3006 (Vol. 71, No. 230) pp. 69208-69211, at http://aspe.hhs.gov/health/fmap08.htm
The Nonelderly Uninsured,by Age and Income Groups, 2006 Other Adultswithout Children21% Total = 46.5 million uninsured Low-income includes those with family incomes less than 200% FPL. SOURCE: KCMU/Urban Institute analysis of March 2007 CPS.
States Moving Forward with Initiatives to Address the Uninsured SOURCE: KCMU survey of Medicaid officials in 50 states and DC conducted by Health Management Associates, October 2007.
Use of Medicaid to Expand Coverage • Reach eligible, but not enrolled children • Raise eligibility levels for parents • Expand waivers or allow coverage for childless adults • Provide premium subsidies for low-income workers that are financed with Medicaid funds • Help finance safety net services / community-based care • Provide broad-based coverage for people with disabilities
Challenges facing Medicaid within Broader Health Care System • Financing • Federal deficit estimated at $482 billion for FY 2009 • State fiscal capacity (over half states face budget shortfall in FY 2009) • Health care costs • Health care spending growing about 2.5 percentage points faster than GDP • Physician supply • DHHS 2006 report projected shortfall of approximately 55,000 physicians in 2020 • Technology • Needed federal support in adoption of health IT • Quality of care • Geographic variation in treatment patterns