Australia: Leading Global Hub for Clinical Trials and Pharmaceutical Research
A comprehensive report by the Economist Intelligence Unit highlights Australia's strengths in the pharmaceutical industry, showcasing its cost-effectiveness, high-quality workforce, and excellent patient participation rates in clinical trials. With an average clinical trial cost of $3,984 per patient and efficient study completion rates, Australia is positioned as an attractive destination for conducting clinical research. The report benchmarks the Australian industry against global standards, revealing its competitive advantages and commitment to international collaborations in biopharma.

Australia: Leading Global Hub for Clinical Trials and Pharmaceutical Research
E N D
Presentation Transcript
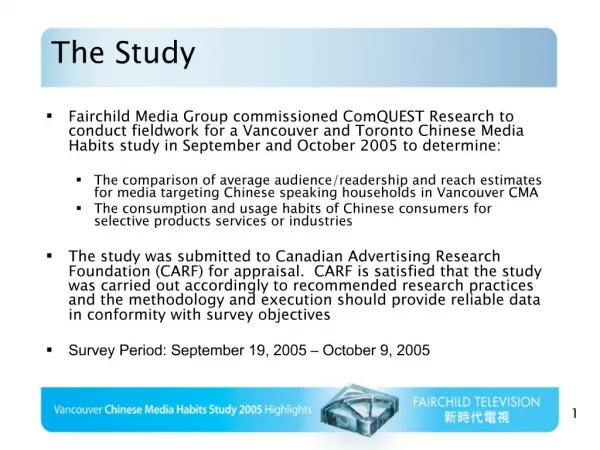
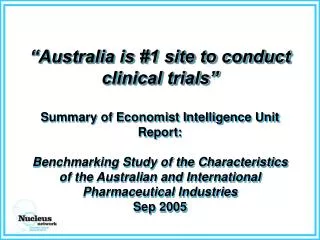
“Australia is #1 site to conduct clinical trials”Summary of Economist Intelligence Unit Report: Benchmarking Study of the Characteristics of the Australian and International Pharmaceutical IndustriesSep 2005
About the study • Independent study conducted by Economist Intelligence Unit • Commissioned by Australian Govt. Dept. Industry Tourism & Resources, Invest Australia, Victorian Govt. Dep. Innovation, Industry & Regional Development • Benchmarked Australian Industry versus: • USA • UK • Germany • Japan • Singapore • India Full report available at: www.industry.gov.au
Clinical Trials Benchmarking Aggregate Benchmark Scores What is driving Australia’s performance?
Driven by low average cost per patient and high availability of research sites… Average cost per patient # sites per 100,000 pop. $6,712 (USA) to $2,500 (India) $3,984 (Australia) 25,000 (USA) to 11 (Singapore) 2,500 (Australia) source: CentreWatch
…Good participation rates andhigh on-time completion rates… # patients in trials per 100,000 pop. % Studies completed on time 3,600,000 (USA) to 3,745 (India) 20,000 (Australia) 85% (India) to 10%(USA) 80% (Australia) source: CentreWatch
…with a capacity to do more... #Phase I per 100,000 pop. #Phase II per 100,000 pop. #Phase III per 100,000 pop. #Other Phase per 100,000 pop. Other includes Phase IV, medical device, bioequivalence
…and a quality workforce Pharma Industry skilled professionals per 100,000 LF. #Graduate degrees per 100,000 LF. Regulatory & Quality Systems Govt. Initiatives & Incentives Other includes Phase IV, medical device, bioequivalence
Clinical Trial Activity 2004 2005
Snapshot of Australian Pharma & Biotechnology Industry • Pharma company sales in Australia $6b (1.2% of world market) • 93% prescription sales covered under PBS (Govt. funded) • 57% having some degree of local manufacture • Export sales of Pharmaceuticals $2.4b • 421 Core biotechnology companies (83 listed) • Market cap $4.3b (ex. CSL) • 612 Medical device companies (45 listed) • Market cap $9.0b Source: Bioindustry Review 2006
Australian Biotech sector is very active in forming alliances 28% Internal 36% North America 2% Africa 3% NZ/Pacific 12% Asia 19% Europe • 112 alliances formed with US companies in 2005 • Australian Biotechs purchased 24 overseas companies Source: Bioindustry Review 2006
Key Takeaways: • Australia is an excellent location for conducting clinical research • Australia has a vibrant Biotech & pharmaceutical sector • Australian companies want to work with international partners