Investment Approach
Investment Approach. ROCKBRIDGE INVESTMENT MANAGEMENT, LLC. Efficient Market Hypothesis. The Hypothesis States : Current prices incorporate all available information and expectations. Current prices are the best approximation of intrinsic value. Price changes are due to unforeseen events.

Investment Approach
E N D
Presentation Transcript
Investment Approach ROCKBRIDGE INVESTMENT MANAGEMENT, LLC
Efficient Market Hypothesis The Hypothesis States: • Current prices incorporate all available information and expectations. • Current prices are the best approximation of intrinsic value. • Price changes are due to unforeseen events. • “Mispricings” do occur but not in predictable patterns that can lead to consistent outperformance. Implications: • Active management strategies cannot consistently add value through security selection and market timing. • Passive investment strategies reward investors with capital market returns.
Principles • Markets work. • Capital markets do a good job of fairly pricing all available information and investor expectations about publicly traded securities. • Diversification is key. • Comprehensive, global asset allocation can neutralize the risks specific to individual securities. • Risk and return are related. • The compensation for taking on increased levels of risk is the potential to earn greater returns. • Portfolio structure explains performance. • The asset classes that comprise a portfolio and the risk levels of those asset classes are responsible for most of the variability of portfolio returns.
Our Investment Philosophy Simple Disciplines: Believe markets work Understanding Risk Rebalance Control Costs
Structure the Portfolio – Achieve Desired Risk Exposure SECURITY SELECTION DECISION Determine Appropriate Investment Risk for the Client ASSET ALLOCATION DECISION Investment Philosophy Capital Markets Work Measure Results and Compare to Appropriate Benchmarks Reevaluate and Rebalance Applying the Science of Capital Markets to the Investment Process
What Sets Us Apart • A Trusted Advisor • We take pride in helping people achieve their long-term investment goals and provide our clients with the ongoing investment support they need. • A Focus on Asset Allocation • Most of the variation in a portfolio’s return is explained by its allocation among several broad asset classes. • The strategic asset allocation defines risk. • A Conviction that Costs Matter • By keeping investment costs at an absolute minimum, plan participants realize substantial benefits in their accounts over time.
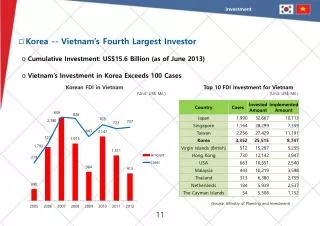
Risk and Return Are Related • Equity Market • (complete value-weighted universe of stocks) • Stocks tend to have higher expected returns than fixed income over time. • Company Size • (measured by market capitalization) • Small company stocks tend to have higher expected returns than large company stocks over time. • Company Price • (measured by ratio of company book value to market equity) • Lower-priced “value” stocks tend to have higher expected returns than higher-priced “growth” stocks over time. Small Increased Risk Exposure and Expected Return Value Growth Decreased Risk Exposure and Expected Return Total Stock Market Large
Value Stocks vs. Large StocksMonthly: July 1926-December 2008 Percentage of All Rolling Periods Where US Large Value Index Outperformed S&P 500 Index
Small Stocks vs. Large StocksMonthly: July 1926-December 2008 Percentage of All Rolling Periods Where US Small Cap Index Outperformed S&P 500 Index
Mutual Fund Expenses “After costs, the return on the average actively managed dollar will be less than the return on the average passively managed dollar for any time period.” —William F. Sharpe, 1990 Nobel Laureate Domestic Mutual Fund Expense Ratios International Mutual Fund Expense Ratios Average of All Funds Weighted Average, Based on Fund Assets Weighted Average, Based on Fund Assets Average of All Funds Average of All Funds Weighted Average, Based on Fund Assets Weighted Average, Based on Fund Assets Average of All Funds Active Passive Active Passive
Fees Matter Assumed 6.5% Annualized Return over 30 Years 1% Fee $4,983,951 • Fees matter. • Over long time periods, high management fees and related expenses can be a significant drag on wealth creation. • Passive investments generally maintain lower fees than the average actively managed investment by minimizing trading costs and eliminating the costs of researching stocks. $5,000,000 2% Fee $4,000,000 $3,745,318 3% Fee Dollars $3,000,000 $2,806,794 $2,000,000 $1,000,000 1 Year 3 Years 5 Years 10 Years 20 Years 30 Years Time
Why Hire a Financial Manager? • The importance of the fiduciary relationship • We work for you – in your best interest as • Acting as your agent • The importance of discipline • Most individual investor act on both knowledge and emotion, tempting them to invest in sub-optimal ways. • Serving as your agent, we employ only knowledge and scientific principle – purely rational decision making. • We use time tested, scientifically based, well defined process to achieve superior results. • The importance of costs • Because our services are fee based, we never take commissions • Commissions significantly degrade your portfolio over time