Lecture 1 Describing Inverse Problems
640 likes | 828 Vues
Lecture 1 Describing Inverse Problems. Syllabus.

Lecture 1 Describing Inverse Problems
E N D
Presentation Transcript
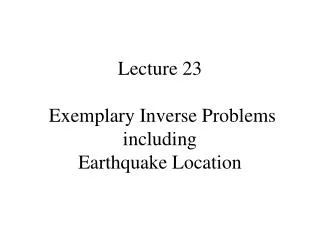
Syllabus Lecture 01 Describing Inverse ProblemsLecture 02 Probability and Measurement Error, Part 1Lecture 03 Probability and Measurement Error, Part 2 Lecture 04 The L2 Norm and Simple Least SquaresLecture 05 A Priori Information and Weighted Least SquaredLecture 06 Resolution and Generalized Inverses Lecture 07 Backus-Gilbert Inverse and the Trade Off of Resolution and VarianceLecture 08 The Principle of Maximum LikelihoodLecture 09 Inexact TheoriesLecture 10 Nonuniqueness and Localized AveragesLecture 11 Vector Spaces and Singular Value Decomposition Lecture 12 Equality and Inequality ConstraintsLecture 13 L1 , L∞ Norm Problems and Linear ProgrammingLecture 14 Nonlinear Problems: Grid and Monte Carlo Searches Lecture 15 Nonlinear Problems: Newton’s Method Lecture 16 Nonlinear Problems: Simulated Annealing and Bootstrap Confidence Intervals Lecture 17 Factor AnalysisLecture 18 Varimax Factors, Empircal Orthogonal FunctionsLecture 19 Backus-Gilbert Theory for Continuous Problems; Radon’s ProblemLecture 20 Linear Operators and Their AdjointsLecture 21 Fréchet DerivativesLecture 22 Exemplary Inverse Problems, incl. Filter DesignLecture 23 Exemplary Inverse Problems, incl. Earthquake LocationLecture 24 Exemplary Inverse Problems, incl. Vibrational Problems
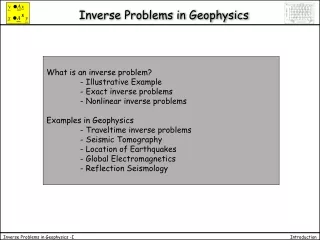
Purpose of the Lecture distinguish forward and inverse problems categorize inverse problems examine a few examples enumerate different kinds of solutions to inverse problems
Part 1Lingo for discussing the relationship between observations and the things that we want to learn from them
data, d = [d1, d2, … dN]T things that are measured in an experiment or observed in nature… model parameters, m = [m1, m2, … mM]T things you want to know about the world … quantitative model (or theory) relationship between data and model parameters
data, d = [d1, d2, … dN]T gravitational accelerations travel time of seismic waves model parameters, m = [m1, m2, … mM]T density seismic velocity quantitative model (or theory) Newton’s law of gravity seismic wave equation
Forward Theory mest dpre Quantitative Model estimates predictions Inverse Theory dobs mest Quantitative Model estimates observations
mtrue dpre Quantitative Model due to observational error ≠ dobs mest Quantitative Model
mtrue dpre Quantitative Model due to observational error due to error propagation ≠ ≠ dobs mest Quantitative Model
Understanding the effects of observational error is central to Inverse Theory
A. Implicit Theory L relationships between the data and the model are known
Example • mass = density ⨉ length ⨉ width ⨉ height • M = ρ⨉ L ⨉ W ⨉ H • L • H ρ • M
weight = density ⨉ volume measure • mass, d1 • size, d2, d3, d4, want to know • density, m1 • d=[d1, d2, d3, d4]T and N=4 m=[m1]T and M=1 • d1 = m1 d2 d3 d4 ord1 - m1 d2 d3 d4 = 0 f1(d,m)=0 and L=1
note No guarantee that f(d,m)=0 contains enough information for unique estimate m determining whether or not there is enough is part of the inverse problem
B. Explicit Theory the equation can be arranged so that d is a function of m • d = g(m) or d - g(m)= 0 L = N one equation per datum
Example • rectangle • H • L • Circumference = 2 ⨉ length + 2 ⨉ height • Area = length ⨉ height
Circumference = 2 ⨉ length + 2 ⨉ height C = 2L+2H • Area = length ⨉ height A=LH measure • C=d1 • A=d2 want to know • L=m1 • H=m2 • d=[d1, d2]T and N=2 • m=[m1, m2]T and M=2 d1 = 2m1 + 2m2 d2 m1m2 • d=g(m)
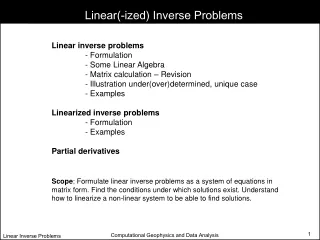
C. Linear Explicit Theory the function g(m) is a matrix G times m • d = Gm Ghas N rows and M columns
C. Linear Explicit Theory the function g(m) is a matrix G times m • d = Gm “data kernel” Ghas N rows and M columns
Example • quartz • gold • total volume = volume of gold + volume of quartz • V = V g+ V q • total mass = density of gold ⨉ volume of gold • + density of quartz ⨉ volume of quartz • M = ρg⨉ V g+ ρq⨉ V q
V = V g+ V q • M = ρg⨉ Vg+ ρq⨉ V q measure • V = d1 • M = d2 want to know • Vg =m1 • Vq=m2 • assume • ρg • ρg • d=[d1, d2]T and N=2 • m=[m1, m2]T and M=2 • known • 1 • 1 • d = • m ρg ρq
D. Linear Implicit Theory TheL relationships between the data are linear L rows N+M columns
in all these examples m is discrete discrete inverse theory one could have a continuous m(x) instead continuous inverse theory
as a discrete vector m in this course we will usually approximate a continuous m(x) • m = [m(Δx), m(2Δx), m(3Δx) … m(MΔx)]T but we will spend some time later in the course dealing with the continuous problem directly
A. Fitting a straight line to data T = a + bt temperature anomaly, Ti (deg C) time, t (calendar years)
each data point is predicted by a straight line
matrix formulation d = G m M=2
B. Fitting a parabola • T = a + bt+ ct2
each data point is predicted by a strquadratic curve
matrix formulation d = G m M=3
straight line parabola note similarity
in MatLab G=[ones(N,1), t, t.^2];
C. Acoustic Tomography h h 1 2 3 4 5 6 7 8 source, S receiver, R 13 14 15 16 travel time = length ⨉ slowness
matrix formulation d = G m N=8 M=16
In MatLab • G=zeros(N,M); for i = [1:4] for j = [1:4] % measurements over rows k = (i-1)*4 + j; G(i,k)=1; % measurements over columns k = (j-1)*4 + i; G(i+4,k)=1; end end
D. X-ray Imaging (A) (B) S R1 R2 R3 R4 R5 enlarged lymph node
theory I = Intensity of x-rays (data) s = distance c = absorption coefficient (model parameters)
Taylor Series approximation
discrete pixel approximation Taylor Series approximation
discrete pixel approximation Taylor Series approximation length of beam i in pixel j d = G m
matrix formulation d = G m N≈106 M≈106
note that G is huge106⨉106but it is sparse(mostly zero)since a beam passes through only a tiny fraction of the total number of pixels
in MatLab G = spalloc( N, M, MAXNONZEROELEMENTS);
single spectral peak area, A p(z) width, c z position, f
q spectral peaks “Lorentzian” d =g(m)