Download
1 / 64
640 likes | 978 Vues
The Competitive Firm. Chapter 7. In this Chapter. 7.1. Market Structure 7.2. Profit Maximization for A firm in Perfectly Competitive Market 7.3. When to Shutdown; and the Supply Curve of a Competitive firm. The Profit Motive.

E N D
The Competitive Firm Chapter 7
In this Chapter.. 7.1. Market Structure 7.2. Profit Maximization for A firm in Perfectly Competitive Market 7.3. When to Shutdown; and the Supply Curve of a Competitive firm
The Profit Motive • The basic incentive for producing goods and services is the expectation of profit. • Profit is the difference between total revenue and total cost.
Other Motivations • Personal reasons also motivate producers. • Producers seek social status and crave recognition. • Non-owner managers of corporations may be more interested in their own jobs, salaries, and self-preservation than earning profits for stockholders.
Is the Profit Motive Bad? • The profit motive encourages businesses to produce the goods and services consumers’ desire, at prices they are willing to pay.
What Proportion of the Sales Price, do you think, goes to Sellers (Producers) as Profit? • The typical consumer believes that 35¢ of every sales dollar goes to profits. • In reality, average profit per sales dollar is closer to 5¢.
Economic and Accounting Profits • Economic profit is the difference between total revenues and total economic costs. • Economiccost is the value of all resources used to produce a good or service – opportunity cost.
Economic and Accounting Profits • To determine a firm’s economic profit, all implicit factor costs must be subtracted from observed accounting profit.
Economic and Accounting Profits • Economic profits represent something over and above normal profits. • Normal profit is the opportunity cost of capital • A productive activity reaps an economic profit only if it earns more than its opportunity cost.
Entrepreneurship • The inducement to take on the added responsibilities of owning and operating a business is the potential for profit. • The potential for profit is not a guarantee of profit. • substantial risks are attached to starting and operating a business. • The opportunity for profit may be limited by the structure of the industry.
Market Structure • Market structure refers to the number and relative size of firms in an industry. • Two broad Categories 1. Perfectly Competitive 2. Imperfectly Competitive
II. Imperfect competition I. Perfect • Monopolistic Competition competition Market Structure • Oligopoly • Monopoly • Duopoly
I. The Nature of Perfect Competition • Distinguishing characteristics: • Many firms – lots of firms are competing for consumer purchases. • Identical products – the products of the different firms are identical, or nearly so. • Low entry barriers – it’s relatively easy to get into the business. • Perfect Information-Every body knows every thing about the market
Market Structure • Perfect competition is a market in which no buyer or seller has market power.
Price Takers • A perfectly competitive firm has no market power and thus has no ability to alter the market price of the goods itproduces. • Market Power – The ability to alter the market price of a good or service.
Price Takers • The output of a perfectly competitive firm is so small relative to market supply that it has no significant effect on the total quantity or price in the market. • Pricing decision is thus beyond the control of the firm • The firm has to decide on how much to produce
Market Demand Curves vs. The Demand Curves Facing A Firm • It is important to distinguish between the market demand curve and the demand curve confronting a particular firm.
Market Demand Curves vs. Firm Demand Curves • The market demand curve for a product is always downward-sloping.
Equilibrium price PRICE (per shirt) Quantity (thousand shirts per day) Market Demand Curves vs. Firm Demand Curves The T-shirt market Market supply pe Market demand
Market Demand Curves vs. Firm Demand Curves • The market demand curve for a product is always downward-sloping. • However, the demand curve confronting a perfectly competitive firm is horizontal
Demand facing one shop Equilibrium price PRICE (per shirt) Demand facing single firm Quantity (thousand shirts per day) Quantity (shirts per day) Market Demand Curves vs. Firm Demand Curves The T-shirt market Market supply pe pe Market demand
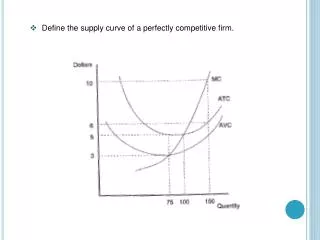
The Production Decision • Thus a competitive firm has only one decision to make: how much to produce. • Theproduction decision is the selection of the short-run rate of output (with existing plant and equipment).
Output and Revenues • In searching for the most desirable rate of output, the distinction between total revenue and total profit must be kept in mind. • Total revenue - The price of the good multiplied by the quantity sold in a given time period. Total revenue = price X quantity
Output and Revenues • Total Revenue: • PXQ • Total Revenue Curve • an upward-sloping straight line • The Slope of The TR Curve: • pe.
$96 Total revenue 88 80 72 64 56 Total Revenue 48 40 32 24 16 pe= $8 8 0 1 2 3 4 5 6 7 8 9 10 11 12 Quantity Total Revenue
Output and Costs • To maximize profits a firm must consider how increased production will affect costs as well as revenues. • Producers are saddled with certain costs in the short-run. • Short-run - The period in which the quantity (and quality) of some inputs cannot be changed.
Output and Costs • Fixed costs - Costs of production that do not change when the rate of output is altered, e.g., the cost of basic plant and equipment. • Fixed costs are incurred even if no output is produced. -Variable costs - Costs of production that change when the rate of output is altered, e.g. labor and material costs. • Once a firm starts producing output, it incurs variable costs as well.
z Total Cost (dollars per time period) Output (units per time period) Total Cost Total cost Total costs escalate due to the law of diminishing returns Fixed cost
Output and Costs • The shape of the total cost curve reflects increasing marginal costs and the law of diminishing returns. • Marginal cost is the increase in total costs associated with a one-unit increase in production.
Output and Costs • Given these conditions, the producer’s problem is to find that one particular rate of output that maximizes profits.
r Revenues Or Costs (dollars per period) s Output (units per period) Total Profit Total cost Total revenue Profits Losses f h g
Profit-Maximizing Rule • The best single rule for maximizing short-run profits is … • To never produce a unit of output that costs more than it brings in. • What does this means?
Profit-Maximizing Rule • The producer has to compare the contribution ofthe additional unit of the output to the total revenue with the what it costs to produce that additional unit. • The contribution to total revenue of an additional unit of output is called marginal revenue.
Profit-Maximizing Rule • Marginal revenue(MR) is the change in total revenue that results from a one-unit increase in the quantity sold. • In a perfectly competitive market, MR is simply the price of the product; MR=P
Marginal Cost • We know that, for a firm in perfectly competitive market, the price of its product is its marginal revenue. • The firm’s goal is not to maximize revenues, but to maximize profits….To achieve this goal.. • … the firm has to compare its Marginal Revenue with its Marginal Costs and determine the best level of output.
Marginal Cost • Recall: • Just as what an additional unit of output brings in is the firms marginal revenue (MR); • Marginal cost is what it costs the firm to produce the additional unit of the output
Profit-Maximizing Output • a firm should produce at that rate of output where marginal revenue equals marginal cost. • Max Profit: MR=MC • As MR=P; the Profit maximizing Rate of output is one that can be produced when marginal cost equals the price of the product • P= MC
Profit-Maximizing Output • If marginal cost exceeds price, total profits decline if the additional output is produced. • If marginal cost is less than price, total profits increase if the additional output is produced. • Profits are maximized at the rate of output where price equals marginal cost.
Short-Run Profit-Maximization Rules for Competitive Firm Price > MC increase output Price = MC maintain output and maximize profit Price < MC decrease output
$18 Marginal cost 16 Profits decreasing 14 Price (= MR) 12 Profits increasing 10 Price or Cost (per bushel) 8 6 4 2 0 1 2 3 4 5 6 7 Quantity (bushels per day) Profit-Maximizing Rate of Output p = MC MRB Profit-maximizing rate of output MCB
Adding Up Profits • Profits can be computed in two ways. 1. As a difference between total revenue and total cost. Total profit = total revenue – total cost
Adding Up Profits 2. As a difference between Price and average total cost times the number sold. Profit per unit = price – ATC Total profit = (p – ATC) X q
Total revenue and total cost Price and average cost $90 $18 Average total cost 80 16 70 14 Total revenue Price Total Profit 60 12 Maximum total profit Profit per unit 50 10 Revenue or Cost (dollars per day) Price or Cost (per unit) 40 8 30 Total cost 6 Cost per unit Marginal cost 20 4 10 2 0 1 2 3 4 5 6 7 0 1 2 3 4 5 6 7 Rate of Output Rate of Output Alternative Views of Total Profit
Implication… • The profit-maximizing producer has no desire to produce at that rate of output where ATC is at a minimum. • I.e., profit max output is not necessarily at the point where ATC is the lowest.
The Shutdown Decision • In a competitive market, the short-run profit maximization rule does not guarantee any profits. • It tells the output level that maximizes economic profit. • A firm in such a market thus always want to produce that level of output. • However, a competitive market is characterized by free entry (lack of barriers to entry).