Download

1 / 72
730 likes | 873 Vues
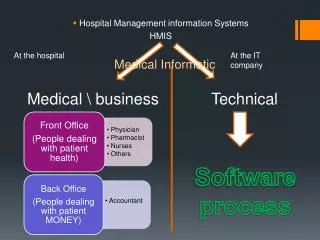
Hospital Systems. Impacts on Cost and Quality Walton Hancock. What Systems?. Inpatient Admissions Operating Room Nurse Staffing Nurse Daily Assignments Ancillary Staffing Outpatient Scheduling Transporters. Selection Rationale. There are approximately 5000 hospitals in the US.

E N D
Hospital Systems Impacts on Cost and Quality Walton Hancock
What Systems? • Inpatient Admissions • Operating Room • Nurse Staffing • Nurse Daily Assignments • Ancillary Staffing • Outpatient Scheduling • Transporters
Selection Rationale • There are approximately 5000 hospitals in the US. • Of these, 121 are “teaching” hospitals. • All of these hospitals need systems to do most of the work. • Little attention has been focused on the best methods to do the work.
Selection Rationale Continued • Many of the present systems result in poor quality, excess costs and chaotic environments for the patients and employees. • On an annual basis, hospitals are 98% fixed costs, so, after we change the systems, we must change the staff and staffing patterns to fit the demand.
Selection Rationale Continued • A typical bed cost per day is at least $1500. This is the most expensive component of stay costs. • Thus, we must organize so that the LOS is not extended by poor systems. • We must obtain maximum occupancy subject to our quality requirements.
Inpatient Admissions Systems • This system determines how well we use the hospital resources. • Emergencies are 32% of admissions. The rest are elective and can be scheduled to accomplish the objectives. • A patient admission loads the nursing and ancillary services. Thus, optimum staffing is dependent on admissions procedures.
Inpatient Admissions Systems • Usually, the OR’s schedule patients with no communication with Admissions. • OR’s schedule 5 days per week. Thus occupancy falls on weekends. • Most medical admissions occur on weekends, Monday and Tuesday. Physicians have to declare an emergency to get a medical patient admitted on Wednesday or Thursday.
Inpatient Admissions Systems • In many cases, there are no beds available for emergencies on Wednesdays and Thursdays. • Surgical cancellations are frequent due to lack of beds. • Patients are placed on the wrong units. A surgical patient placed on a medical floor increases the LOS by 1.0 days.
Inpatient Admissions Systems • Ironically, the patients who receive the best care are those who are placed in the hall! • These problems cause the Admissions department to reduce average occupancy to cut down the tension.
Inpatient Admissions Systems • Proposed goals: • Maximum occupancy subject to: • All emergencies will be promptly admitted. • All elective surgery will have a bed available • All call-ins will be admitted within three days.
Inpatient Admissions Systems • Analyze the patient admissions data for the past two years • Produce a vector diagram of the patient flows.
Inpatient Admissions Systems • Load the admissions rates and their LOS into a digital simulator. • Determining the admissions decision rules for 9:00 a.m., 11:00 a.m. and 2:00 p.m. for each day of the week.
Inpatient Admissions Systems • Most hospitals have an 11:00 a.m. discharge time. None enforce it. • Because discharges occur throughout the day and admissions are typically at 2:00 p.m., admissions decisions have to be made at 9:00 a.m.,11:00 a.m. and 2:00 p.m.
Inpatient Admissions Systems • In order to obtain maximum average occupancy, a medical call-in queue is established. These are patients who are not emergency, but need to be admitted within three days.
Admissions Worksheet • Specific numbers are obtained from the simulator for each day . • A worksheet is prepared for the admissions clerk. • Sometimes the worksheet is put on a computer, but not immediately.
Occupancy Curves • Maximum average occupancy is a function of several factors. • Curves are develop to show the relationships and to help understanding. • More specific maximum average occupancy numbers are obtained using a 23 term regression equation.
Results • The average increase in occupancy using 14 hospitals is 5.5% • To prevent problems, the resultant chaos, and quality problems, we cannot exceed a maximum average occupancy. • The OR schedule must be stabilized. Specific numbers of surgeries should be done each day.
Implementation • Implementation was greatly aided because all of the “powerful actors” benefited: • Surgeons could do more procedures per week • Admissions personnel had a much easier time. • Administrators had increased revenue and/or lower costs.
Increased Revenues • The typical hospital has 250 beds with a room rate of at least $1500 per day. • 250*.055*1500*365= $7,528,125 increase in revenue assuming sufficient patient demand. • Countrywide, the increased in revenue is • $37,640,625,000
Cost Savings • Assuming costs that could not be changed are 40%, the savings by reducing the number of beds that we need not staff, would be: • $7,528,125*.60 = $4,516,875 per hospital. • $22,584,375,000 countrywide. • Implementation costs are $100,000.
Hospital Planning • This admission simulator was used to plan the new (1980) Michigan hospital. • The size of each medical service was determined. • Changes in medical practice were forecasted and incorporated in the final numbers. • The issue of tertiary vs. secondary patients was painfully discussed and resolved.
Hospital Planning • The patient flow diagrams show the number of patients placed on the wrong units because of lack of beds on the primary unit. • Units can be resized so that wrong patient placement is minimized.
Operation Room Systems Scheduling OR’s
Operating Room Operations • Average use of OR’s is 52% with a six figure overtime bill. • OR’s are scheduled with no regard for available beds. • Surgical cancellations due to lack of beds are frequent. • OR’s cost $30.00 to $45.00 per minute.
Operating Room Operations • Many OR’s lack operational discipline: • Procedures do not start on time. • Clean up takes from 15 to 60 minutes. • Block schedules are not kept up to date. • Schedules use average times. • Case carts are not kept up to date. • Little or no attempt is made to standardize the case cart contents.
Surgery Scheduling • Set a maximum limit on the number of surgeries each day. This number can only be exceeded with permission of the Admissions Department. • Example: • Sun. Mon. Tues. Wed. Thur. Fri. Sat. • 0 19 17 15 14 14 0
OR Scheduling • We need means and variances for the following sub procedures by procedure and by surgeon: • Induction • Setup • Procedure • Recovery • Room cleanup
OR Scheduling • 27% average on time starts. • 31.5 minutes average turnaround
OR Scheduling • Unfortunately, the existing history files are full of poor information, so we need to build a new file where: • The beginning and end points are defined. • Any standardization attempts are done first. Examples: Room clean up should be 20 minutes or less. • Case cart loading is done the night before.
Surgery Scheduling • Objectives: • Start procedures on time 95% of the time. • Finish in 8 hours 95% of the time. • Blocks finish on time 95% of the time. • Schedule with a phone call.
Nursing Operations Staffing
Nurse Staffing • 4.2 hours per day per patient is the most commonly used number for acute beds. • This assumes that the nurse cares for all of the patients needs. • For a 250 bed hospital, we need 181.25 nurses spread over 3 shifts. • Usually, it is 2.0 hours for shift 1, 1.2 for shift 2 and 1.0 for shift 3.
Nurse Staffing • Approximately 35% of a nurse’s time is used to care for the patient’s medical needs. 65% is for physical needs. • On the first shift, the nurse can care for 8/2 or 4 patients. • If the nurse has an aid on the first shift, then there are 16 hours available. 16/2=8, the number of patients the team can care for.
Nursing Procedures Lack of Standarized Work
Nurse Staffing • Recent studies have indicated that 33% of a nurse’s time each day is spent trying to find things. The inference is that their workplaces are not standardized. My estimate is that 25% of this could be eliminated. • 4.2 could be reduced to 3.15 NH/PD. • $3,832,500 saved in a 250 bed hospital or $19,162,500,000 countrywide.
Nursing Operations Nurse Assingments
Nurse Assignments • Each patient needs certain care. How do we assign the nurses so there is a high probability needs will be met? • We need to classify each patient at the end of the previous shift so that assignment takes place within the first five minutes of the next shift. • We need to provide the admissions dept. with knowledge of where there is an excess of nursing staff.