Download
1 / 25
250 likes | 383 Vues
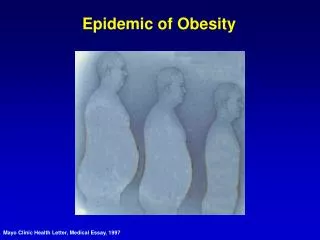
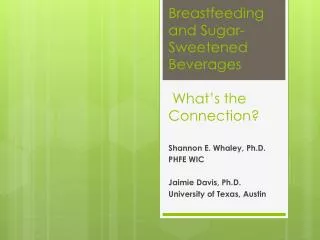
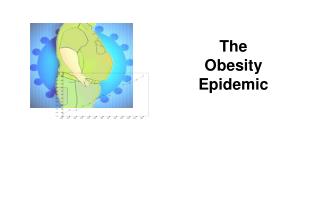
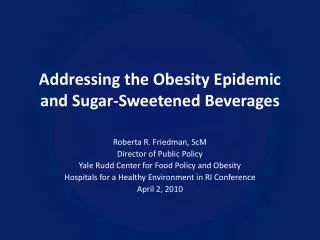
Addressing the Obesity Epidemic and Sugar-Sweetened Beverages. Roberta R. Friedman, ScM Director of Public Policy Yale Rudd Center for Food Policy and Obesity Hospitals for a Healthy Environment in RI Conference April 2, 2010. The Rudd Center. Strategic Science Economics

E N D
Addressing the Obesity Epidemic and Sugar-Sweetened Beverages Roberta R. Friedman, ScM Director of Public Policy Yale Rudd Center for Food Policy and Obesity Hospitals for a Healthy Environment in RI Conference April 2, 2010
The Rudd Center • Strategic Science • Economics • Food Marketing to Youth • Law, Nutrition & Obesity • Public Policy • Schools, Families & Communities • Weight Bias & Stigma • Food & Addiction
Today • Science • Mechanisms • Inconsistencies in literature
Added Sugars • Sugar induces all of the diseases associated with metabolic syndrome, including: • Hypertension • High triglycerides and insulin resistance • Diabetes Lustig, Nature, 2012
Empty Calories 250 calories 16 tsps sugar
48 Teaspoons Sugar Portion Sizes 16 oz 32 oz 44 oz 52 oz 64 oz
Intake Average US intake = 45 gallons/yr Average US child = 193 calories/day Andreyeva, 2011; Smith, 2010
Health Outcomes • Wt gain/obesity • Type 2 diabetes • Cardiovascular disease • Diet Quality • Dental caries • Osteoporosis • Gout No credible evidence of benefit
Obesity • Children • Every additional serving of per day increased risk by 60% • More likely to be overweight and obese later in life • Adults • 1 or more SSB/day = 27% more likely to be overweight
Clear association of intake w. increased calories, body wt., risk of diabetes AJPH, 2007
Recent large studies show relationship between long-term weight gain, type 2 diabetes, CVD Phys & Behav, 2010
Cardiovascular Disease • Link to • Higher blood pressure • Adolescents’ risk of CVD and type 2 • Waist circumference • High LDL cholesterol • Low HDL • Hypertension
Deterioration in dietary quality lower intakes of calcium, fiber, micronutrients, other protective compounds Dental caries consistent observational and laboratory data Osteoporosis displacement of calcium-containing foods, effects of phosphoric acid, other components Other Concerns
Mechanism • Sugar in liquid form less filling than in solid • We don’t compensate for extra liquid calories by eating fewer calories from solid food Mourao, IJO, 2007; DeCastro Physio Behav, 1993; Harnack, JADA 1999
…studies funded by the food industry reported significantly smaller effects than did non–industry-funded studies. AJPH, 2007
Industry funding increased likelihood of finding favorable to the sponsor by 4 to 8-fold Lesser, et al., PLoS, 2007
Thank you! Roberta.Friedman@yale.edu www.yaleruddcenter.org www.yaleruddcenter.org/ssbtax