Data Acquisition System using MATLAB & PIC Microcontrollers
United Arab Emirates University College of Engineering Training & Graduation Projects Unit. Data Acquisition System using MATLAB & PIC Microcontrollers. Students’ Name: Suad Abdullah 200200301

Data Acquisition System using MATLAB & PIC Microcontrollers
E N D
Presentation Transcript
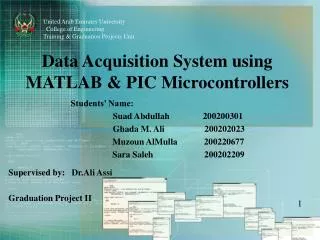
United Arab Emirates University College of Engineering Training & Graduation Projects Unit Data Acquisition System using MATLAB & PIC Microcontrollers Students’ Name: Suad Abdullah 200200301 Ghada M. Ali 200202023 Muzoun AlMulla 200220677 Sara Saleh 200202209 Supervised by: Dr.Ali Assi Graduation Project II
Objectives • Development and design of a Data Acquisition (DAQ) System using MATLAB tool environment. • Voltage, current, temperature and light will be sensed using appropriate sensors. • The PIC microcontroller will be programmed in order to acquire the data from sensors and convert it from analog to digital using A/D converter (built in). • The PIC microcontroller will send the data to a PC using serial port_ RS-232. The data will be processed and plotted using MATLAB tool. 2
Experiments with the PIC • Experiment 1: Explore the function of the built in Analog to Digital converter of the PIC. • Experiment 2: Data communication between two PCs using the serial ports. • Experiment 3:Modifying the code of the PIC program. • Experiment 4: Writing the MATLAB code for acquiring voltage data from the solar cells.
Experiments with the PIC. • Experiment 5: Writing the MATLAB code for acquiring temperature data from the solar cells using the LM-35 (temperature sensor). • Experiment 6: Designing the GUI interface in MATLAB. • Experiment 7: Final PBP code for acquiring and transmitting voltage, temperature and light data.
PIC Microcontroller • The name PIC stands for : • Peripheral Interface Controller • Programmable Intelligent Computer • The meaning of PIC Microcontroller: • A processor with built in memory and RAM and you can use it to control your projects. So it saves you building a circuit that has separate external RAM, ROM and peripheral chips.
The PIC16F877 Microcontroller PIC16F877 was chosen because of several reasons: • 1. It is the ideal solution for use as a standard controller in many applications. • 2. It is available in the laboratories of United Arab Emirates University and lab engineers are familiar with such controller.
The PIC16F877 Microcontroller PIC16F877 Microcontroller includes : (1) 8kb of internal flash Program Memory. (2) A large RAM area and an internal EEPROM. (3) An 8-channel 10-bit A/D converter.
PicBasic Compiler • Makes it even quicker and easier to program PICmicro microcontrollers. • The English-like BASIC language is much easier to read and write than the original Microchip assembly language. • The PicBasic Pro Compiler is “BASIC Stamp II like” and has most of the libraries and functions of both the BASIC Stamp I and II. • programs execute much faster and may be longer than their Stamp equivalents.
Programming the PIC PBP Compiler Using CDL Executed by Source File Flash.pbp Compile Using CDL Connect Melabs U2 Programmer The PIC programmed Flash.ASM and Flash.HEX
The equipments used for Programming the PIC microcontroller. The ZIF Adaptor The melab U2 programmer Connecting melabs U2 programmer to the ZIF Adapter
Experiment 1: Explore the function of the built in Analog to Digital converter of the PIC. What is A/D converter? It is an electronic device that converts an analog voltage (or current) to a digital form. The PIC16F877 has: 10 bit A/D Module 8Channels
Circuit Implementation for the Analog to Digital Conversion.
MATLAB Code for the Analog to Digital Conversion Set number of bits of the result (8, 10 or 12) Set the clock source Set the sampling time in microseconds Define Pin 0 of Port B as a BYTE
MATLAB Code for the Analog to Digital Conversion Set Port A to all input PORTA is analog Read channel 0 to B0 Set Port B to all as output
Prototype of the A/D converter Circuit. 11111111= “255” 00000101=“5” • Conversion of a analog value “5” to digital “00000101” Conversion of a analog value “255” to digital “11111111”
Experiment 2: Data communication between two PCs using the serial ports. Block diagram of the serial communication.
Serial Communication via RS-232 • Serial communication is the most common low-level protocol for communicating between two or more devices. Modem Printer Computer Scientific Instrument (Oscilloscope or Function Generator) Computer
Serial port RS-232 • Three pins are used for communications: • One for receiving data • One for transmitting data • One for the signal ground.
MAX 232 chip When communicating with various micro processors one needs to convert the RS232 levels down to lower levels, typically 3.3 or 5.0 Volts.
Connected pins between serial port and the MAX-232. • Pin 11 from MAX232 was connected to pin 26 in PIC16F877 in order to transmit the data from the PIC microcontroller to the MAX232. • Pin 16 was connected to the +5V power supply and Pin 15 was connected to the ground. • Female 9 pin was connected to pins 14 and 13 respectively so it can provide 2 channels for the RS232 cable .
The implemented circuit and the serial communication result that appeared on the hyper terminal.
Experiment 3:Modifying the code of the PIC program. • The difference between SEROUT and SEROUT2 command is SEROUT2 can set the parameter more than SEROUT command such as data format, transmit format and baudrate. Changed to SEROUT2 function
Experiment 4: Writing the MATLAB code for acquiring voltage data from the solar cells.
Experiment 5: Acquiring temperature data from the solar cells using the LM-35 (temperature sensor). The LM35 series are precision integrated-circuit temperature sensors, whose output voltage is linearly proportional to the Celsius (Centigrade) temperature.
Features of the LM35 • Guarantee able (at +25°C) • Rated for full -55° to +150°C range • Suitable for remote applications • Low cost • Operates from 4 to 30 volts • Low self-heating•
The implemented circuit for acquiring the temperature data . • Lighter was used to make the LM35 work. LM 35
The acquired temperature data(output) as shown and plotted in Matlab.
Light Sensor (Photo Resist). What does light sensor do? • The light sensor is used to detect changes in the amount of light in its surroundings. The output voltage increases as the light level increases.
Light Sensor (Photo Resist). • The animation opposite shows that when the torch is turned on, the resistance of the LDR falls, allowing current to pass through it.
Light Sensor (Photo Resist). Photo resist (light sensor)
Experiment 6: Designing the GUI interface in MATLAB. • GUI interface was implemented in order to plot the measurements of voltage, temperature and light. The GUI interface.
Results of the Data Acquisition System using MATLA & PIC Microcontrollers GUI program
Experiment 7: Final PBP code for acquiring and transmitting voltage, temperature and light data.
Conclusion • Environmental Issues. • Clean source of power (Solar) • Cost Issues. • Relatively cheap. • Technical Issues. • Accurate readings and measurements.


![CM [A] R’s “MarLIN” Metadata System - or, how do we discover what data we’ve got??](https://cdn2.slideserve.com/4543203/cm-a-r-s-marlin-metadata-system-or-how-do-we-discover-what-data-we-ve-got-dt.jpg)