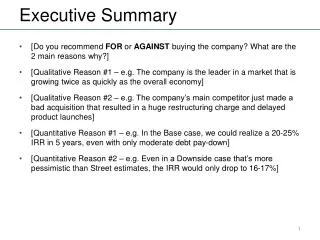
Executive Summary
Executive Summary 2003-2004 Snow and Ice

Executive Summary
E N D
Presentation Transcript
Executive Summary 2003-2004 Snow and Ice Materials, equipment and labor were consumed to meet Department Target Regain Times for the five maintenance roadway classes: Super Commuter 1 to 3 hours, Urban Commuter 2 to 5 hours, Rural Commuter 6 to 9 hours, Primary 6 to 12 hours and Secondary 9 to 36 hours. These times are measured from the end of a storm event to the time “bare lanes” are regained. The bare lane criterion was established using customer market research which determined that drivers felt comfortable maintaining posted speeds when the driving lane were clear, even though the center line and edge lines were covered with small amounts of snow. Additional labor, equipment and materials were used to attain bare “pavement” where all snow and ice were removed from all driving surfaces and pavement markings and to complete storm cleanup. District work plans addressed the procedures for meeting these goals. Executive Summary ITEMSQUANTITIES$FY 2004 Snowfall for season66.3 in. (10 yr. Avg. 58.6) Number of lane miles30,481 Statewide salt usage230,918 tons $7,964,098 Statewide sand usage111,210 tons $781,662 Statewide brine usage1,505,435 gallons $131,318 Total Material Costs $8,877,078 Labor Costs (Regular and Overtime) $6,934,619 Equipment Costs $16,588,851 Statewide Average for Labor, Equipment and Material Costs Per Lane Mile $1,093.34
Statewide Compare Notes: See District Summaries
Statewide Notes: See Executive Summary
District 1 Notes: Tim Sheehy
District 1 Comments District 1,Tim Sheehy The year was very snowy, 106" (60" last year) of snow was recorded in Duluth making it the 5th snowiest winter since the weather service began keeping records. We had 39 events this year and were in snow and ice operations 99 days (not including cleanup or stockpiling) which accounted for 33,212 regular hours and 8,684 overtime hours. We used: 35,276 tons of salt, 32,160 tons of sand, 229,436 gallons of brine and 135,419 gallons of MaCl. January was the busiest month with district crews working 27 days out of 31 in snow and ice removal. Close
District 2 Notes: Dave Dalager
District 2 Comments District 2, Dave Dalager Total snowfall for the NW Dist 2 was 59.5 inches. Chemical usage was up by 30% over last season due to types of events. Overtime was also up from last season. Lots of events caused by blowing snow sticking to the road surface in Feb. and March. This was not a severe winter by any means, however was significantly more severe than recent seasons. Potholes are abundant this Spring because of all the freeze-thaw cycles. Close
District 3A Notes: Lee Purdham
District 3A Comments District 3A, Lee Purdham The average snowfall for maintenance area 3A in March was nine inches. Average for this season so far is seventy inches. Average number of events for March was six. Two of the events included freezing rain. Average number of events so far for this season is twenty-five. Total material and labor usage for the season so far under activity 2406 is: Salt 9,453 tons Sand 1,459 tons Salt Brine 68,896 gallons Regular labor hours 11,235 Overtime hours 1,605. Close
District 3B Notes: Randy Reznicek
District 3B Comments District 3B, Randy Reznicek This was more of a normal winter for 3B with a mixture of wet snow, Alberta clippers, freezing drizzle, trace events and wind for drifting problems. November started our winter with snow events scattered throughout the month along with some wind and drifting events. December followed with more events, most of which were the trace to 2 inch variety and one event with some significant snow. January started with small events and finished the month with a couple of good snowfall events that ranged throughout 3B in the 4 to 8 inch range. February brought several accumulating snow and ice events throughout the month. March came with three normal events with snow and a couple of minor events in the first week and a half and then winter just faded away quickly! Salt Usage: 17,985 tons Sand Usage: 4,497 tons Brine Usage: 244,303 gallons Total Events: 28 Early Call-Ins: 29 Late Splits: 20 Weekend Callouts: 14 Snowfall for the Season: 50.3 inches Regular Hours to Plowing & Sanding: 23,337 hrs ($440,491) OT Hours to Plowing & Sanding: 4,359 hrs ($123,875) Average Regain Time Super Commuter: 2.2 hrs Close
District 4 Notes: Dean Olson
District 4 Comments District 4, Dean Olson Snowfall was 84 inches in the northern part of the District 4 and less in the far south part of the District. The average number of events is 29 for the season. Material usage: Salt ------- 15,191 Ton for the season Sand ------ 11,042 ton for the season Salt Brine - 193,520 gallons for the season Gemo melt M - 1,500 gallons for the season Labor: Regular hours ----- 24,445 hours Over time hours -- 2,689 hours Average regain time for District 4 -- 8.3 Close
District 6E Notes: Brian Wolfgram
District 6E Comments District 6E, Brian Wolfgram The 2003-2004 snow and ice season started out warmer than normal and dry. Snow started falling in December and colder temperatures in January. The last week in January and the first two weeks of February was our busiest time. During those 3 weeks, 16 days out of 21 were committed to regaining bare lanes with nearly 2 feet of snow falling. Overall 2003-2004 snow and ice season was normal. Data for the year: Salt usage - 15,329 tons Sand usage - 17,488 tons Brine usage - 249,801 gallons Total Events - 33 A shift splits - 24 B shift splits - 18 Days committed to regaining bare lanes - 53 (40 weekdays - 11 weekend days - 2 holidays) First event Nov. 3rd 2003 - last event March 18th, 2004 Snowfall for the year - 48.4 inches Hours charged to plow routes - 12,600 regular hours, 3,773 overtime hours Close
District 6W Notes: Wesley Smith
District 6W Comments District 6W, Wesley Smith Operations data for the year: 27 events, 38.5 inches of snow We incorporated liquid corn salt (LCS) into our stock pile set up @ Austin & Faribault. We used 9,000 gallons costing $ 12,150 total for the season It looks very promising and we intend to use it at both locations again this coming season, with the testing not completed I'm reluctant to wholesale it area-wide, if next season is a traditional winter we will have a good sense of what LCS can do for us in treating or stock piles. LCS was used as an anti-icing chemical and gave us comparable results to using salt brine. One benefit we did see as the road dried off there was no visible dust as we have seen in areas using salt brine and yet the LCS had the same residual effect as salt brine days later. Close
District 7E Notes: Tony Desantiago
District 7E Comments District 7E, Anthony Desantiago Had a total 3.6 inches in the Mankato Area, bringing the total to 42 inches for the season. The southern part of the district had around 5" of snow. We only had one event for the month of March for a season total of 16. A fairly quiet month for our area. Close
District 7W Notes: Tom Zimmerman
District 7W Comments District 7W, Thomas Zimmerman The total number of events this year averaged across the area is now at 23. Total snowfall for the winter is around 60". Early in the winter, our events were typically snow with warm temperatures and wind. This pattern continued through most of January. By the end of January and into early February, the temperatures were very cold. By the middle to end of March, most of the winter weather had ended with almost no snow and ice operations in April. As shown below, our numbers are higher in all categories based on our historical averages. Our overtime usage in comparison to the number of regular hours used shows the commitment to reducing overtime if possible. We were able to do this with more frequent splitting of shifts and because there were a limited number of snow events that caused us to work weekends and holidays. You may notice that the number of events typically are low in this area. This is primarily due to the winds increasing the durations of the events that we do have. Over the past three seasons, the comparison of the duration of the events is shown below. Winter of: 2001/2002 2002/2003 2003/2004 =========================================================================== # of Events 16 16 23 Average duration in hours per event 12.93 hours 8.35 hours 25.48 hours Season Totals: 2003/2004 Historical Averages =========================================================================== Snow Fall 60" 48" Number of Events 23 16 Regular Hours 13,400 9,330 Overtime Used 3,657 3,484 Mixed Winter Sand 8,226 Tons 8,562 Tons Salt 6,609 Tons 5,597 Tons Brine 108,517 Gallons 41,792 Gallons Close
District 8 Notes: Jeff Butson
District 8 Comments District 8, Jeff Butson There were no snow events in April. So the season had 23 events with 45" of snow. Used magnesium chloride as an anti icing chemical in the Willmar area. Treated all the bridges on the TH 71 bypass. Also used salt brine in many truck stations on bridges and their highways thru town. Activity 2406 Season Totals Salt: 10,085 Ton Sand: 13,418 Ton Brine: 133,387 Gallons Magnesium Chloride: 2000 Gallons Close
Metro Notes: Norm Ashfeld
Metro Comments Metro, Norm Ashfeld The 03-04 snow and ice season for the Metro District started on November 2nd and ended for most parts on March 16th. We have not had any measurable snow since March 16th. Metro District received 66.3" of snow in 26 events. We used approximately 80,000 tons salt, 3,000 tons of sand, 11,000 gallons of Potassium Acetate, 8,000 gallons of salt brine, and 31,500 gallons of magnesium chloride for anti-icing efforts. Metro consumed 104,653 labor hours of which approx. 30% were in overtime hours. The Metro District used the RWIS system quite extensively this past winter season. It provided us with some valuable information as we track the beginning of a storm so we can predict when we should have our personnel on duty. The problems we experienced with the RWIS system this past season included some communication problems between the field RPU's and the server, mostly with information updating. Close
Statewide: By District By Type of Road Minnesota Duluth 1http://www.dot.state.mn.us/d1/ Bemidji 2 http://www.dot.state.mn.us/d2/ Brainerd 3 http://www.dot.state.mn.us/d3/ Detroit Lakes 4http://www.dot.state.mn.us/d4/ Twin Cities – Metro Areahttp://www.dot.state.mn.us/metro/ Willmar 8http://www.dot.state.mn.us/d8/ Rochester 6 http://www.dot.state.mn.us/d6/ Mankato 7 http://www.dot.state.mn.us/d7/