Download
1 / 13
140 likes | 487 Vues
How do you describe the spread of this data?. 0 1 2 3 4 5 6 7 8 9 10. How many times have you gotten 100% on a spelling test this year?.

E N D
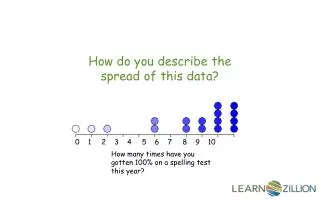
How do you describe the spread of this data? 0 1 2 3 4 5 6 7 8 9 10 How many times have you gotten 100% on a spelling test this year?
In this lesson you will learn how to describe the spread of data by finding the range, interquartile range, and mean absolute deviation.
Reading a Line Plot How many books did 6th graders at Taylor Middle School read this summer? 0 2 4 6 8 10 12 14 16 18 20 22 Number of Books
Students sometimes confuse the measures of center and spread. Center Mean Median Mode Spread Range Interquartile Range Mean Absolute Deviation
Finding the Range 1 0 - 0 1 0 0 1 2 3 4 5 6 7 8 9 10 How many times have you gotten 100% on a spelling test this year?
Finding the Interquartile Range 9.5 - 5 4.5 0 1 2 3 4 5 6 7 8 9 10 How many times have you gotten 100% on a spelling test this year?
Finding the Mean Absolute Deviation. 2 2 2 2 3 3 3 3 0 + 1 + 2 + 5 + 5 + 7 + 7 + 8 + 8 + 9 + 9 + 9 + 9 + 10 + 10 + 10 + 10 = 118 118 ÷ 17 = 7 Mean = 7 2 2 0 0 1 1 7 6 5 0 1 2 3 4 5 6 7 8 9 10 How many times have you gotten 100% on a spelling test this year? 7 + 6 + 5 + 2 + 2 + 0 + 0 + 1 + 1 + 2 + 2 + 2 + 2 + 3 + 3 + 3 + 3 = 44 44 ÷17 ≈ 2.6
In this lesson you have learned how to describe the spread of data by finding the range, interquartile range, and mean absolute deviation.
Find the range, interquartile range, and mean absolute deviation. 0 2 4 6 8 10 12 14 16 18 20 22 Number of Books Books Read this Summer by 6th Graders
Find a graph in your math book or online. Summarize the spread by finding the range, interquartile range, and mean absolute deviation.
Write a statistical question and survey your classmates. Find the spread of the data by finding the range, interquartile range, and mean absolute deviation.
Find the range, interquartile range, and mean absolute deviation of this data. 7 8 9 10 11 12 13 14 15 16 17 How many letters are in your first and last name?
What do the range, interquartile range, and mean absolute deviation tell us about the spread of this data? 7 8 9 10 11 12 13 14 15 16 17 How many letters are in your first and last name?