(Indices for) Climate Extremes
(Indices for) Climate Extremes. RA VI CLIPS workshop Erfurt, Germany, 12-18 June 2003 Albert Klein Tank KNMI, the Netherlands Acknowledgement: ECA&D-participants. Guide. How to define extremes and analyse changes in extremes? Indices for daily T and R extremes in ECA&D

(Indices for) Climate Extremes
E N D
Presentation Transcript
(Indices for) Climate Extremes RA VI CLIPS workshop Erfurt, Germany, 12-18 June 2003 Albert Klein Tank KNMI, the Netherlands Acknowledgement: ECA&D-participants
Guide • How to define extremes and analyse changes in extremes? • Indices for daily T and R extremes in ECA&D • Observed trends in Europe, 1946-now • Indices and applications / climate services • Hands-on training using ClimDex (NCDC/NOAA)[thanks Volker(H), Patricia & Stefan]
Guide • How to define extremes and analyse changes in extremes? • Indices for daily T and R extremes in ECA&D • Observed trends in Europe, 1946-now • Indices and applications / climate services • Hands-on training using ClimDex (NCDC/NOAA)
! www.cred.be
WMO status of global climate in 2002 www.wmo.ch
Guide • How to define extremes and analyse changes in extremes? • Indices for daily T and R extremes in ECA&D • Observed trends in Europe, 1946-now • Indices and applications / climate services • Hands-on training using ClimDex (NCDC/NOAA)
Recall from yesterday: ECA&D • Initiated by ECSN/EUMETNET • Co-ordinated by KNMI • (Voluntary) participation of RA VI countries • Report and papers issued in 2002 • New start in January 2003; next report in 2006 • Now is the time to join!
If you want your free copy, just send an e-mail to: kleintan@knmi.nl
Concept of ECA&D • Copies of daily data series collated at KNMI • Core set of indices for extremes calculated using fixed definitions (CCL/CLIVAR ETCCMD) • Results presented at website and discussed with participants • Results are European input to worldwide analyses (e.g. in preparation for IPCC 4AR) • Results are also used by e.g. EEA
Data QC & Homogeneity • Participants perform QC on daily data submitted • 4 common statistical tests applied on derived monthly and annual series • Only confident station series kept for further analyses • Use of MASH for homogenisation of monthly series explored in co-operation with HMS (Szentimrey) • How to homogenize daily series is still an open question
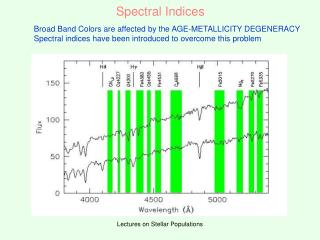
Temperature Wijngaard et al., Int. J. of Climatol., 2003
Day-count indices of extremes www.knmi.nl/samenw/eca/
Day-count indices of extremes www.knmi.nl/samenw/eca/
3x 6x Day-count indices of extremes Relation between relative trend bq/X required for 80% detection probability (5% level) and series length N for extreme events with average return period Tret Klein Tank and Können, J. Climate (accepted)
upper 10-ptile 1961-1990 the year 1996 lower 10-ptile 1961-1990
“cold nights” upper 10-ptile 1961-1990 the year 1996 lower 10-ptile 1961-1990
“warm nights” “cold nights” upper 10-ptile 1961-1990 the year 1996 lower 10-ptile 1961-1990
“Amplified” response of very wet days Linear trends in rainy season, last ~50 years Easterling et al. (BAMS, 2000) in IPCC-TAR
2) Determine fraction of total precipitation in each year that is due to these days 3) Trend analysis in series of fractions Precipitation fraction due to very wet days “R95%tot” 1) Identify very wet days using a site specific threshold = 95th percentile at wet days in the 1961-90 period
Guide • How to define extremes and analyse changes in extremes? • Indices for daily T and R extremes in ECA&D • Observed trends in Europe, 1946-now • Indices and applications / climate services • Hands-on training using ClimDex (NCDC/NOAA)
European temperature trends • Recent trends (1946-1999) in temperature extremes reflect the general warming: fewer cold extremes, more warm extremes • Averaged over all stations, the first decades of slight cooling saw narrowing of temperature distributions, whereas the last decades of strong warming saw widening of temperature distributions • IPCC-TAR: • “lengthening of the freeze-free season in most mid- and high latitude regions” • “reduction in frequency of extreme low monthly and seasonal average temperatures and smaller increase in frequency of extreme high average temperatures”
European precipitation trends • Averaged over Europe, all indices of wet extremes saw increases between 1946-1999, although spatial trend coherence is low and many station trends are not significant • The index that represents the fraction of the annual amount due to very wet days gives a signal of disproportionate large changes in the extremes • IPCC-TAR: • “2 to 4% increase in frequency of heavy events in mid- and high latitudes of the NH” • “in regions where total precipitation has increased ... even more pronounced increases in heavy precipitation events”
Trends 1961-2001 APN 2002 (Della-Marta, Haylock et al.) www.bom.gov.au/bmrc/csr/apn/
Caribbean workshop, Jamaica 2001 (Peterson et al., 2002, JGR)
Trends in 5-day rainfall total 1961-1990 Africa workshop, Casablanca 2001
WMO/CCL • OPAG2: Monitor. and Anal. of Clim. Var. and Change • 2.3 ETCCDMI; indices of daily to seasonal extremes in observations and models • OPAG3: CLIPS • 3.8 ET on Health-related climate indices and their use in early warning systems (Jendritzky) • 3.10 Rapporteur(s) on use of climate indices in various application areas (Akentyeva/Khlebnikova)
Guide • How to define extremes and analyse changes in extremes? • Indices for daily T and R extremes in ECA&D • Observed trends in Europe, 1946-now • Indices and applications / climate services • Hands-on training using ClimDex (NCDC/NOAA)