Download

1 / 46
460 likes | 620 Vues
Resources and Newfoundland and Labrador’s Future. A Presentation to Grenfell Campus’s Office of Alumni Affairs and Navigate Entrepreneurship Centre By Wade Locke Department of Economics, MUN. Room AS 2026 Grenfell Campus Corner Brook, NL March 2, 2013. Introduction (1).

E N D
Resources and Newfoundland and Labrador’s Future A Presentation to Grenfell Campus’s Office of Alumni Affairs and Navigate Entrepreneurship Centre By Wade Locke Department of Economics, MUN Room AS 2026 Grenfell Campus Corner Brook, NL March 2, 2013
Introduction (1) • I want to thank Grenfell Campus’s Office of Alumni Affairs and Navigate Entrepreneurship Centre for inviting me to speak to you this morning • I would like to give you some sense of what I see happening in the economy and the role played by natural resources
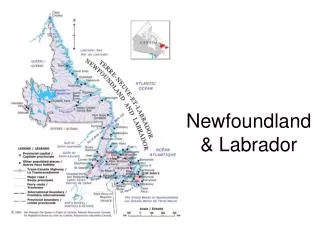
Introduction (2) • Newfoundland and Labrador has always been a resource dependent economy • Originally, NL was seen as a convenient fishing base where settlement was discouraged and restricted initially • NL was a resource dependent economy, primarily fishing, then forestry, pulp and paper (GF 1909 and CB 1925), mining (Bell Island 1895 and IOC 1962) and oil (Hibernia discovered in 1979 and produced in 1997) represented an increasing share of NL economy • The cod moratorium (1992) made a depressing situation desperate • However, the future is bright, but there are challenges from a fiscal and labour perspective
NL Population Population fell from high of 580,109 (1992) to 506,330 (2007) – a fall of 73,770 (12.7%) Population is starting to increase slightly. Between 2006 and 2012, population has increased by 7,225 people (from 506,330 in 2007 Q3 to 513,555 in 2012 Q4) If the resource projects, that are expected for the province, proceed, we are likely to see a significant increase in population; otherwise they cannot proceed because we do not have enough workers and we have an aging labour force
Aging Population The population is getting older and the fastest growing group is those people that are closer to retirement - age 45 to 64 years. The age distribution is not projected to get better An aging population will have implications for workforce and implications for housing market (types and value of houses needed)
We Are Getting Older Since 1999, NL older population than country as a whole In 2012, NL 44.2 years old and CDN 40.0 years old An aging population will reduce the supply of labour because people eventually retire, reduce hours of work or die. Higher wages will delay retirement for some and will attract others into labour force. Unfortunately, attracted workers may not be perfect substitutes in terms of productivity – not the same quality in terms of transferrable skills, experience, motivation and ability.
Aging Population & Potential Workforce Potential retirees started to exceed new entrants into the labour force for NL by 2006 Currently, potential retirees exceed the new entrants into the workforce by 34%
NL GDP and Personal Income Per Capita Relative to Canada GDP/POP PI/POP After 1997, our fortunes started to change, but the real transformation started after 2005. Currently (2011) GDP per capita Canada-wide is $51,109, while GDP in NL in 2011 was $65,557
Unemployment Rate Canada and NL Improving throughout Canada and NL. Since 2000 when NL rate was 244% of CDN rate, it has improved to 174% of CDN rate in 2012. Steady improvement since 1993 (20.1%) to 2012 (12.5%)
Employment Growth Since 1976 Overall employment has grown by 45% since 1976, about half of this growth has occurred since 1997 While the goods sector is basically the same size, the oil and gas/mining employment has replaced the fall in employment from the fisheries/pulp and paper industries The service sector has grown by 67%
Employment Growth Since 1976 Employment in the health sector has more than doubled (212%), education has grown by 34% and public administration has increased by 90%, since 1976 Public Administration has increased throughout the 1980s, declined slightly before increasing since 2004, growing by 21% since then
Average Weekly Wages NL as % of CDN Average weekly wage now above the Canadian average since 2011-09 This has been increasing steadily since 2004
Average Hourly Wages by Sector in NL as % of CDN (2008/01 and 2013/01) NL wages in all industries improving relative to Canada in both skilled and unskilled areas. Surprisingly, retail sales represents one of the largest increase relative to Canada
Median Employment Income of Tax Filers: NL as a Percent of Canada and Relative to 2000 NL as Per Cent of CDN Growth Since 2000 Something is already happening in NL, certainly since 2006. Median employment income has grown relative to the national average (from 73% to 88%) and since 2000, employment income has grown by 62% in NL and 35% nation-wide
Business Confidence Small businesses in Newfoundland and Labrador are very confident about the future
Consumer and Business Bankruptcy – St. John’s Clear decline in business bankruptcies and no significant change in consumer bankruptcies in St. John’s
Assessed Values (excluding St. John’s) Since 2006, assessed value have had a substantial increase in NL (excluding SJ). Recent figures released by the MMA, indicate that average residential assessment has increased by 42% from 2010 to 2013, by 130% from 2006 to 2013 and by 65% from 2006 to 2011 This is reflective of what is happening with prices. Not spread evenly across the province and is reflective of economic activity
Housing Starts and Residential Building Permits Residential building permits have increased dramatically, especially since 2006 (156% increase – 2012 (to July) averaged $70 M and $27 M in 2006 (whole year) Housing starts have picked up after 2000, but this may tend to moderate in the medium term
New Housing Price Index New housing prices have increased by approximately 50% since 2007 Appears to have stabilized in the last year
Housing Prices Since 2006, when the impact of oil started to have a significant impact on the provincial economy, NL housing prices have grown significantly – in both absolute terms and relative to the rest of Canada NL prices increased from $139,542 in 2006 to $268,776 in 2012 (93% higher than 2006) and the forecast for 2013 is $278,500 (100% higher than 2006) From 2005 to 2012, CDN prices increased by 31%
Newfoundland and Labrador Housing Market Prices, houses for sales and sales have increased dramatically since 2007 Prices are still strong, but sales seem to be returning to longer term trend Newly completed and unabsorbed houses appear to be reaching some kind of steady state, but have declined dramatically over the years, with a secondary peak in 2006 Expect prices to continue to increase, but at a moderate rate and sales are expected to remain at around 4,500 in the short term
Government Expenditures – A Comparison NL expenditure 50% higher than CDN Ave, 43% higher than Maritime Provinces ad 17% higher than SK (the next highest province)
Health Expenditure – A Comparison Health Expenditure in NL is above the CDN Ave and this divergence has become larger over time
Per Capita Expenditure on Health Care – NL (2010) Source: CIHI data An aging population will put more pressure on health care costs within the province If no other cost drivers change (doctor’s salaries, cost of band aids, etc.), then in 20 years the median age (44 yrs) person’s health cost will double and double yet again in another 10 years
Oil Prices While government assumed oil prices in the order of $124/bbl at budget time, prices have averaged $109.87 since April and $111.54 since August Prices becoming more variable over time The forecast was optimistic and will, according to Budget 2013, will result in a deficit that is $430 million, not $250 million expected at Budget 2012
Oil Price Forecasts – Brent Crude Oil price forecast used in the sustainability plan are in the middle of available public forecasts and are certainly lower than those predicted by the 40 top forecasters surveyed by Bloomberg ( Lloyds TSB Bank PLC, TD Bank, Citigroup, Barclays, CIBC, RBC , Deutsche Bank, Credit Suisse, Goldman Sacks, Bank of America Merrill Lynch, eg) There should be no problem meeting $105 per barrel for the next three years
Government Deficits There have been budget surpluses in six of last eight years. This is the first time in our history, but, according to information released with the budget, we are expecting two more years of deficit before returning to surplus From 1949 to 1993, there were cash surpluses in only two years. The cumulative surpluses in the last 10 years, according to the recent AG report, were $3.5 B, while Accord payments over the same period was $5.0 B
Debt Servicing As a Percent of Revenue Things have improved – there used to be $1 in every $4 required to service the debt, but not $1 in $9 Without measures introduced in the sustainability plan, we are in danger of going back to an ever increasing share of revenues needed to cover debt servicing
Net Debt Government of NL Net debt has come down in recent years, but with lower oil prices, deficits will be higher than forecast and net debt will start to rise unless fiscal measures are undertaken With maturing oil fields, we should expect a downward trend in government revenues and if expenditures are not brought back into line, then deficits and debts will continue to increase. The need to control deficits and debt in the longer term will have implication for public sector compensation and employment and the local housing market
Net Debt Per Capita – A Comparison Our net debt per capita has been coming down, but is danger of increasing significantly without the sustainability plan
Resource Sector Employment Non-renewable resources (mining and oil) employed 10,200 people, in 2012 while renewable resources (fish, forestry, paper) employed 10,500 In 1987, this employment was 30,000 for renewable resources and 3,500 for non-renewable resources While it appears that the cod are recovering, it will be a different kind of industry than in the past – more capital intensive, longer employment per year, and a smaller processing sector than existed in the past
Annual Production for Existing and Planned Offshore Oil Fields • To the end of 2011, 1,288 barrel produced and another 1,483 remain to be produced. • Production from existing fields expected to fall off. • Needs to be updated for additional production from Terra Nova (90 mm bbls) Source: CNLOPB Reserve Estimates and forecasts
Economic Impacts Associated with Development The Hebron development and the White Rose Well Head Platform will occur more or less at the same time and in the same area. This will create a significant demand for labour and will impact the housing market through increasing demand for higher end houses The White Rose development will yield significantly more production, more employment, more business activity and billions in additional royalties
Iron Ore Prices Iron prices started to increase significantly after 2010, rising to US$187/DMT in February 2011 – representing 670% of 2005 prices (US$28/DMT) In Sept price fell to less than US$100/DMT, but have recovered to US$150/DMT in January and currently around $140/DMT We are expecting a fall in prices towards the second half of the year as new capacity comes on stream While the short term will be characterized by price pressures, over time, the market will enable the iron ore projects in NL to proceed
Iron Ore Employment – Various Scenarios We are looking at more than a threefold increase in employment if the iron ore projects under active consideration proceed as expected. If labour and power do not constrain these developments, then we can see a doubling of employment in the iron mining sector for NL
Iron Ore Tax Revenue – Various Scenarios The potential exists to help out with the provincial government’s fiscal position by supplementing government revenue by $700 million per year
Nickel Prices Nickel prices peaked in 2007 just after Voisey’s Bay started (about $23/lb, currently between $7.80/lb). Prices are still above historic levels HMP plant at long Harbour expected to commence in 2013/14 (direct, indirect and induced employment could be in the order of 1,000 people during operations) Voisey’s Bay will go underground. This will have a big employment impact (400-450 direct jobs and total employment impact could approach 1,000 people)
Muskrat Falls This will save consumers $2.4 B in present value terms over the next best alternative It will generate $1.9 B in incomes to Newfoundland and Labradorians, $500 M of which will occur in Labrador It will average 1,500 full-time equivalent jobs each year during construction, peaking at 3,100 jobs in 2015 This will be 9,100 direct person-years of employment over the project and 23,300 direct, indirect and induced employment The government will receive $290 M in taxes associated with the construction activity It will facilitate industrial development in Labrador
Other Energy Resources • 11 Tcf of gas discovered (equivalent to in excess of 3 Sable natural gas developments) and could have as much as 60 Tcf of gas offshore • 2041 Upper Churchill contract ends (5,400 MW of power becomes available) and NL will get 2/3 of higher revenue but it won’t be available for free to NL • More than 5,000 MW of wind energy can be developed within the province (currently between 50 and 100 MW are being generated) • There are other oil fields to be developed and there could be as much as 6 B barrels of oil (half of which is already discovered) • There is west coast oil and gas potential, but that will be seen after the rests of testing
LNG Prices Source: www.realclearenergy.org If LNG prices exceed $10/MMBTU in the UK, then it may be possible to develop the natural gas resources off our shore This could be within the next 10 years
Conclusion • We will remain a resource dependent economy with other oil fields coming on stream within the next 10 to 20 years and within 10 to 15 years natural gas should be feasible to produce as an export option to Europe. • The Lower Churchill (Muskrat Falls and Gull Island), Hebron, Voisey’s Bay HMP and underground, White Rose GBS, Alderon, IOC and Labmag and future offshore projects (eg., Mizzen) will create huge demands for labour and add to the demand for housing • The Labrador Iron ore trough has the potential to be one of the most exciting areas for develop in world. • These development could represent 10% of provincial employment and this could partially offset offshore revenue lost from reduced offshore activity by adding $1 B to government revenues annually • The Lower Churchill and the development of renewable resources offers the potential to continue the transformation of the newfoundland economy from an economy dependent on non-renewable resources to one that is more dependent on renewable resources.