Download
1 / 26
260 likes | 389 Vues
525201 Statistics and Numerical Method Part I: Statistics Week 1I: Data Presentation. 1/2555 สมศักดิ์ ศิวดำรงพงศ์ somsaksi@sut.ac.th. Data type. Attribute data Discrete, proportion and count of defects are the most common We can count Variable data Continuous data

E N D
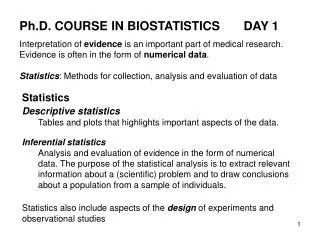
525201Statistics and Numerical MethodPart I: StatisticsWeek 1I: Data Presentation 1/2555 สมศักดิ์ ศิวดำรงพงศ์ somsaksi@sut.ac.th
Data type • Attribute data • Discrete, proportion and count of defects are the most common • We can count • Variable data • Continuous data • We can measure variables Variable data ให้ข้อมูลที่ดีกว่า และต้องการจำนวนข้อมูลน้อยกว่า
Sources of Engineering Data • A retrospective study • Historical data • An observational study • Data from processes or existing operation • A designed experiment • Data from an experiment set for group of interested factors
Ex: The data of the first yield strength (kN) from experiment of circular tubes with cap welded to the end. Calculate the sample average and standard deviation.
EXCEL and Minitab’s results Welcome to Minitab, press F1 for help. Mean of C8 Mean of C8 = 126.222 Standard Deviation of C8 Standard deviation of C8 = 26.1389
Ex: Calculate the sample mean and SD of compressive strength (psi) of 80 Al-Li alloy specimens.
EXCEL and Minitab’s results Results for: Worksheet 2 Mean of C10 Mean of C10 = 162.662 Standard Deviation of C10 Standard deviation of C10 = 33.7732
Graphing Univariate Data • Dot plot • Stem and Leaf Diagram • Histogram • Box Plot • Time Series Plot • Individual Value Plot • Interval Plot • Pareto Multivariate Data • Scatter Plot • Matrix Plot
Stem and Leaf Diagram Stem-and-Leaf Display: Compressive Strength Stem-and-leaf of Compressive Strength N = 80 Leaf Unit = 1.0 1 7 6 2 8 7 3 9 7 5 10 15 8 11 058 11 12 013 17 13 133455 25 14 12356899 37 15 001344678888 (10) 16 0003357789 33 17 0112445668 23 18 0011346 16 19 034699 10 20 0178 6 21 8 5 22 189 2 23 7 1 24 5
Box Plot Q2 Median Extreme Outliers Outliers Whisker Q1 Q3 Whisker Outliers 1.5 IQR 1.5 IQR IQR 1.5 IQR 1.5 IQR Interquartile Range (IQR) = Q3 – Q1
Ex: The wire bond data was shown between Pull strength, Wire length and Die height
Scatter Plot Correlations: Pull Strength, Wire Length Pearson correlation of Pull Strength and Wire Length = 0.982 P-Value = 0.000 Correlations: Pull Strength, Die Height Pearson correlation of Pull Strength and Die Height = 0.493 P-Value = 0.012
Correlation • A measure of linear association between two variables. • The correlation coefficient- which describes both the strength and direction of the relationship. • The correlation coefficient ranges from -1 to 1
Correlation Coefficient; r r=1 r=0.92 r=0 r=-0.92 r=0 r=-1