Download
1 / 45
450 likes | 757 Vues
Environmental Justice and GIS. Debbie Lowe US Environmental Protection Agency Spring 2004 lowe.debbie@epa.gov (415) 947-4155. Outline. EJ Definitions/Policy Framework Use of GIS to display demographics Academic Studies Types – pros/cons Examples Innovative/unique studies

E N D
Environmental Justice and GIS Debbie Lowe US Environmental Protection Agency Spring 2004 lowe.debbie@epa.gov (415) 947-4155
Outline • EJ Definitions/Policy Framework • Use of GIS to display demographics • Academic Studies • Types – pros/cons • Examples • Innovative/unique studies • EJ and GIS in Regulatory Agency • Cumulative Risk • Vulnerability • Discussion
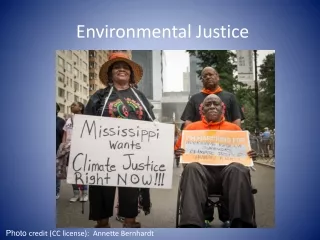
What is Environmental Justice? • EPA definition • “The fair treatment and meaningful involvement of all people regardless of race, color, national origin, or income with respect to the development, implementation, and enforcement of environmental laws, regulations and policies. Fair treatment means that no group of people, including racial, ethnic, or socioeconomic group should bear a disproportionate share of the negative consequences resulting from industrial, municipal, and commercial operations of the execution of federal, state, local, and tribal programs and policies.”
EJ definitions • Maantay (2002) definition • “disproportionate exposure of communities of color and the poor to pollution, and its concomitant effects on health and environment, as well as unequal environmental protection and environmental quality provided through laws, regulations, government programs, enforcement and policies.”
EJ definitions “a national and international movement of all peoples of color to fight destruction and taking of our lands and communities.” “the environmental justice movement emerged as a response to industry and government practices, policies and conditions that people judged to be unjust, unfair, and illegal.”
Clinton Executive Order • Feb 11, 1994, Clinton issued Exec Order • Required each federal agency to • make achieving environmental justice part of its mission and • identify and address “disproportionately high and adverse human health or environmental effects of its programs, policies, and activities on minority populations and low income populations…”
Definitions of Minority and Poverty • CEQ definition -- > 50% or meaningfully greater than general population or reference community • California 53.2% minority • Calif Dept of Finance, Demographic Research Unit 2003 • EPA Inspector General Report • http://www.epa.gov/oigearth/reports/2004/20040301-2004-P-00007.pdf • GIS tools of 3 EPA Regions applied to Worcester, Massachusetts % potential EJ
EPA Minority Definitions • Same definition of minority – different definition of what is significant • Region 1 identified block groups whose minority fraction ranks in the upper 85th percentile among Statewide block groups • Region 5 identified block groups whose minority fraction exceeds twice the State average for block groups • Region 6 (most inclusive) included any block group whose fraction matched or exceeded the State average
IG Comparison of 3 EPA Regions Blue areas indicate overlap
How is GIS used in EJ? • Academic studies • Communities – demonstrate injustices to get more resources/better protection • Regulatory agencies – • To comply with Executive Order • Prioritize – increased inspections/ enforcement actions in EJ areas • Evaluate whether own actions have or will cause injustice
Academic Studies • Proximity to known hazards • Presence of hazardous waste sites/facilities • Exposure to air pollution • Envt hazards (TRI emissions, industrial accidents) • Regulation and cleanup • RODs and cleanups at NPL sites • Assessed fines for envt polln • Health effects • Example, Blood lead • Proximity to prospective hazards • Siting decisions for haz waste sites, incinerators
First EJ Spatial Study • “Toxic Wastes and Race in the United States” • United Church of Christ’s Commission on Racial Justice 1987 • National study • Zip codes with hazardous waste facilities (TSDF) vs. zip codes without • Minority, and income • Zip codes with TSDF had higher % minority
Facility Location • TRI, TSDF, CERCLA • These facilities are registered and tracked on a national level, and consistent info available on each facility, allowing valid comparisons to be made at national level • Data easily accessible, available online • Location info often not accurate • Doesn’t include small facilities – electroplating plants, auto-body shops, dry cleaner – often more emissions
Facility Location = Exposure? • Exposure = facility is located in same zip code, census tract as population • Facility emissions cross boundaries • Can use buffer zones • Assumes every facility emissions equal • Does location really tell you about exposures?
TRI • Again, facility locations problematic • Can look at pounds emitted, disposed of, transferred • Or risk (RSEI) • http://www.epa.gov/opptintr/rsei/ • Self reported data • Small facilities not required to report (<10 employees) • Data requirements have changed over the years • Only one measure of environmental exposures to a community
GIS Proximity Measures • Spatial coincidence • Proximate populations are defined as those residing in the census enumeration unit containing a TRI site • Analytical buffering • Proximate population defined as those living within a predefined distance from a TRI site. • Block groups overlapping with calculated buffer are captured, and area contained within buffer calculated. • Sum population of all block groups in buffer, weighted by fraction of the area of that block group inside the buffer
Unit of Analysis • Glickman and Hersh (1995) study in Allegheny County, Pennsylvania showed that altering unit of analysis affects results • Block group analysis and census tract analysis– minorities in TRI communities lower than in non-TRI communities • Half-mile circles around TRI facilities – minorities in TRI communities higher than non-TRI communities • Generally, smaller group of analysis better
GIS and Lead Poisoning Prevention • Factors for predicting lead poisoning: Age of housing, race/ethnicity, socioeconomic status • Miranda et al (2002) “Mapping for Prevention: GIS Models for Directing Childhood Lead Poisoning Prevention Programs” Environmental Health Perspectives V0l 110, No. 9 947-953 • North Carolina • Census 1990 data: median household income, % of children in poverty, % renters, % single parent households, % African American, % Hispanics, TIGER Census street data • Tax assessor data: year of construction, building type • Blood lead screening data: Dependant variable used to calibrate relative weights assigned to each risk factor
Fox, et al (2002). Evaluating Cumulative Risk Assessment for Environmental Justice: A Community Case Study. Environmental Health Perspectives; Vol 110, Supp 2, 203-209 • CR: Air pollutant data from EPA Cumulative Exposure Project + Tox data • Health measures: Mortality Rates by census tract (minus deaths from car crashes) and YPLL (years potential life lost) • Hypothesis that air CR correlates positively with health measures
Morello-Frosh, et al. (2002)Environmental Justice and Regional Inequality in Southern California: Implications for Future Research. Environmental Health Perspectives; Vol 110, Supp 2, 149-154 • Demographic transition and the siting of environmental hazards • Examines whether neighborhoods that had undergone drastic demographic transitions in their ethnic and racial composition were more vulnerable to TSDF siting due to weak social and political networks that could undermine a community’s capacity to influence siting decisions.
What came first • Pastor et al (2001). Which came first: toxic facilities, minority move-in, and environmental justice. Journal of Urban Affairs, Vol 23, No 1, 1-21. • Interesting academic question, but not important for short-term regulatory action
Web-based GIS tools • EPA Environmental Justice Mapper • http://www.epa.gov/enviro/ej/ • EPA Enviromapper • http://www.epa.gov/enviro/html/em/ • Scorecard • http://www.scorecard.org/
EJ in a Regulatory Agency • Question is different than academic studies • Screening/prioritization – Are there communities where EPA should focus risk reduction activities? • Response – When a community claims environmental justice, how does EPA evaluate this? • Affected community vs. reference community
EPA must consider cumulative risk • NEJAC – outside advisory committee that provides recommendations to EPA on Environmental Justice matters • http://www.tulane.edu/~telc/NEJAC%20Cum%20Risk%20Rpt_Dft%20Fnl.pdfhttp://www.tulane.edu/~telc/NEJAC%20Cum%20Risk%20Rpt_Dft%20Fnl%20App.pdf • Evaluate cumulative risk • Effective tools needed now (don’t spend years developing) • Bias for actions • Implement risk reduction activities in high risk communities
NEJAC -- Vulnerability • Disadvantaged communities have pre-existing deficits of both a physical and social nature that make the effects of environmental pollution more burdensome • Susceptibility/Sensitivity • Genetic susceptibility • Differential Exposure • Proximity to pollution sources, subsistence consumption, lack of information • Differential Preparedness • Poor nutrition, crime, poor community services • Differential Ability to Recover • Lack of access to health care
NEJAC Proposed Indicators Total criteria air pollutant emissions Total toxic air contaminants emissions Population-weighted air emission burden Facility Density (High, Medium and Low emitting sources Total length of Major Roadways Number of LUST Number of Superfund Sites Total release of Toxic Chemicals from TRI Presence/Number of QOL-reducing entities Acreage of Parks/Greenbelts Total Cancer Risk Incidence of Asthma Drinking Water Quality
Other Potential Indicators? • Lead-based paint hazard potential • age of housing, minority, low-income • Pesticide Use Report Database (CA) • Industrial accidents - RMP • Elliott et al “Environmental justice: frequency and severity of US chemical industry accidents and the socioeconomic status of surrounding communities” J Epidemiology Community Health 2004; 58:24-30 • ??
Health Indicators? • Cancer Registry • Birth Defects Registry • Asthma Hospitalization Rates • Low Birth Weight
EPA Permit Decisions • To determine if environmental injustice exists, and whether EPA’s permit decision would cumulatively add to the disproportionate impact • Potential outcomes • Deny permit? • Approve permit w/no EJ conditions • Approve permit w/EJ conditions • EPA actions outside of permit authority to reduce risks in community
EPA Permit Decisions • NEW Draft EPA Guidance • Toolkit for Assessing Potential Allegations of Environmental Injustice • http://www.epa.gov/Compliance/resources/publications/ej/ej_toolkit.pdf • Assessment involves community (interviews) • Assessment focuses on concerns of community • Examines exposures in affected community – compare with reference groups (County or State)