Hydrogen Peroxide on Mars
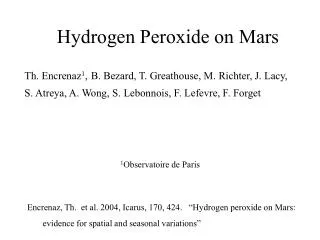
Hydrogen Peroxide on Mars. Th. Encrenaz 1 , B. Bezard, T. Greathouse, M. Richter, J. Lacy, S. Atreya, A. Wong, S. Lebonnois, F. Lefevre, F. Forget. 1 Observatoire de Paris. Encrenaz, Th. et al. 2004, Icarus, 170, 424. “ Hydrogen peroxide on Mars:

Hydrogen Peroxide on Mars
E N D
Presentation Transcript
Hydrogen Peroxide on Mars Th. Encrenaz1,B. Bezard, T. Greathouse, M. Richter, J. Lacy, S. Atreya, A. Wong, S. Lebonnois, F. Lefevre, F. Forget 1Observatoire de Paris Encrenaz, Th. et al. 2004, Icarus, 170, 424. “Hydrogen peroxide on Mars: evidence for spatial and seasonal variations”
Hydrogen peroxide H2O2 has been suggested as a possible oxidizer of the Martian surface. Photochemical models suggest that its mean abundance should be in the range 1015 - 1016 cm-2, and that H2O2 and H2O abundances should be correlated. We report the detection of H2O2 on Mars and its mapping over the Martian disk, using TEXES at the IRTF for Ls = 206°. Data were obtained in June 2003. Two spectral ranges were recorded near 8.1 microns with a spectral resolving power of 70000 and a spatial resolution (after binning) of about 1.5 arcsec. About ten H2O2 lines were distinctly detected over the whole spectral range.
Left: Spectra of Mars (black line) at 1237.2-1243.5 cm-1 (8.1 microns) integrated over a selected area around the sub-solar point and uncorrected for telluric absorptions. The synthetic absorption spectrum of H2O2, corresponding to a mixing ratio of 4x10⁻⁸, is shown for comparison (red line). Absorption lines are due to both telluric and lines of CO2 and H2O2 in the Martian atmosphere. Right: Expanded view showing models corresponding to H2O2 mean vertical mixing ratios of 2x10⁻⁸ (green), 4x10⁻⁸ (red, best fit), and 8x10⁻⁸ (blue) in the atmosphere of Mars.
The mean mixing ratio of H2O2 integrated over the disk is 3x10⁻⁸, corresponding to a column density of 6x1015 cm-2. This is significantly higher than our previous upper limit. Our new result is consistent with the predictions of photochemical models and also with the global measurement obtained by Clancy et al. (2003, Icarus, 168, 116) from submillimeter heterodyne spectroscopy in September 2003 (Ls = 254°) . Left: The spatial distribution of H2O2 inferred from our data shows an enrichment of H2O2 in the morning and around the equator, also in overall agreement with photochemical models.
Summary • Our results are in good agreement with predictions of both 1D and 3D photochemical models. Our measured H2O2 mixing ratio ranges from 2 x10⁻⁸ to 5 x10⁻⁸ in the area where this parameter can be inferred, with a maximum around the sub-solar point. • The enhancement of H2O2 in the morning sector could possibly be explained by the lack of H2O2 photolysis loss throughout the night (Atreya and Gu, 1995), which could result in its build up towards morning. It can also be noted that the region of maximum H2O2 mixing ratio is an area of low altitude (south of Amazonis Planitia), and topographic effects may also be involved. To distinguish between the two possibilities, observations at a different sub- Earth longitude are needed. • Our results of Feb. 2001 and June 2003 show evidence for seasonal variations of the H2O2 content.