Correcting Graphing Errors in Piecewise Functions
This guide provides a structured approach to identifying and correcting common errors in graphing piecewise functions, particularly the function 2x - 3 for x > 0. Key mistakes include incorrect placement of closed dots and inaccurate data points on the graph. A thorough explanation on how to properly indicate closed vs. open dots, as well as a methodology to accurately derive and display critical points, is included. Additionally, a sample data table is provided to ensure precise graphing. Follow these corrections to achieve an accurate representation of the function.

Correcting Graphing Errors in Piecewise Functions
E N D
Presentation Transcript
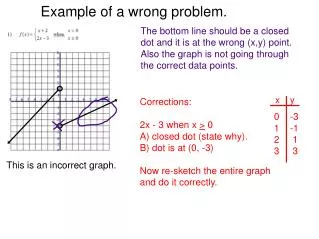
Example of a wrong problem. The bottom line should be a closed dot and it is at the wrong (x,y) point. Also the graph is not going through the correct data points. x y Corrections: 2x - 3 when x > 0 A) closed dot (state why). B) dot is at (0, -3) Now re-sketch the entire graph and do it correctly. 0 -3 1 -1 2 1 3 3 This is an incorrect graph.
Corrected problem (example) 2x - 3 when x > 0 A) closed dot (state why). B) dot is at (0, -3) x y 0 -3 1 -1 2 1 3 3
Examples for WS Corrections. If there is a mark on the dot, then you either missed open/closed dot (correction A) or the circle is correct but the (x,y) coordinates are wrong (correction B). If the word dots is written on the problem, or if a line is circled, then you need more dots to get a more accurate graph. List a table of data for points on the graph (list at least 3 data points). This is the correct graph. If an x is drawn on a piece of your graph, then you have the wrong shape or erased the wrong side (correction D).