Exploring Functional Forms in Economic Models: Chapter 6 Overview
Chapter 6 delves into various functional forms and models used in economic analysis. This chapter features an in-depth examination of log-log and constant growth models, alongside real-world applications such as U.S. GDP per capita and analyses of hyperinflation in Hungary, Germany, and Poland. Key figures illustrate concepts including the natural logarithmic function and Engel curves, showcasing their relevance in understanding economic behaviors over time. Navigate through the figures to grasp the intricate relationships defined by these models.

Exploring Functional Forms in Economic Models: Chapter 6 Overview
E N D
Presentation Transcript
MATTERS OF FUNCTIONAL FORM FIGURES FORCHAPTER 6 Click the mouse or use the arrow keys to move to the next page. Use the ESC key to exit this chapter.
Figure 6.3The constant growth model in discrete time(Y0 = 100, g = 0.05).
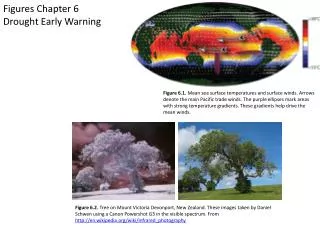
Figure 6.6Prices during the Hungarian hyperinflation of 1945–1946.
Figure 6.8Prais and Houthakker’s Engel curve for meat consumption, based on a lin-log regression model.
Figure 6.10Prais and Houthakker’s Engel curve for meat consumption, based on a reciprocal regression model.
Figure 6.12Alternative functional forms for an Engel curve fitted to Houthakker’s electricity demand data.
Figure 6.13Money and prices during the Germanhyperinflation,September 1920– November 1923 (Sept. 1920 = 1.0).
Figure 6.14Money and pricesduring the Polishhyperinflation, April 1922– November 1923 (April 1922 = 1.0).
Figure 6.15The velocity of money in the United States, 1869–1970.
Figure 6.16Real money holdings log(Mt/Pt ) decline during a hyperinflation.