Download
1 / 21
230 likes | 590 Vues
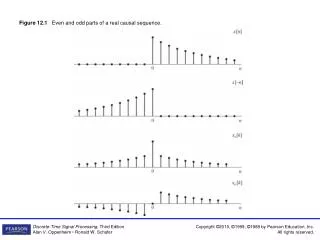
Figure 12.1 Even and odd parts of a real causal sequence. Figure 12.2 Interpretation of the Hilbert transform as a periodic convolution. Figure 12.3 Even and odd parts of a periodically causal, real, periodic sequence of period N = 8.

E N D
Figure 12.2 Interpretation of the Hilbert transform as a periodic convolution.
Figure 12.3 Even and odd parts of a periodically causal, real, periodic sequence of period N = 8.
Figure 12.4 Illustration of decomposition of a one-sided Fourier transform. (Solid curves are real parts and dashed curves are imaginary parts.)
Figure 12.5 Impulse response of an ideal Hilbert transformer or 90-degree phase shifter.
Figure 12.6 Block diagram representation of the creation of a complex sequence whose Fourier transform is one-sided.
Figure 12.7 (a) Impulse response and (b) magnitude response of an FIR Hilbert transformer designed using the Kaiser window. (M = 18 and β = 2.629.)
Figure 12.8 (a) Impulse response and (b) magnitude response of an FIR Hilbert transformer designed using the Kaiser window. (M = 17 and β = 2.44.)
Figure 12.9 Block diagram representation of the allpass phase splitter method for the creation of a complex sequence whose Fourier transform is one-sided.
Figure 12.10 Fourier transforms for representation of bandpass signals. (Solid curves are real parts and dashed curves are imaginary parts.) (Note that in parts (b) and (f) the functions jXi(ejω) and jSi(ejω) are plotted, where Xi(ejω) and Si (ejω) are the Fourier transforms of xi[n] and si[n], respectively.)
Figure 12.11 Block diagram representation of Eqs. (12.75a) and (12.76a) for obtaining a single-sideband signal.
Figure 12.12 System for reduced-rate sampling of a real bandpass signal by decimation of the equivalent complex bandpass signal.
Figure 12.13 Example of reduced-rate sampling of a bandpass signal using the system of Figure 12.12. (a) Fourier transform of continuous-time bandpass signal. (b) Fourier transform of sampled signal. (c) Fourier transform of complex bandpass discrete-time signal derived from the signal of part (a). (d) Fourier transform of decimated complex bandpass of part (c). (Solid curves are real parts and dashed curves are imaginary parts.)