
Figure 12.1 a-c
E N D
Presentation Transcript
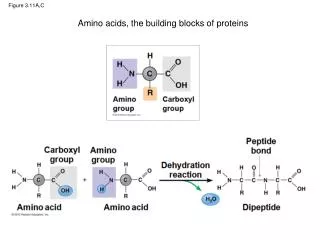
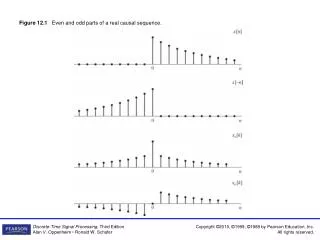
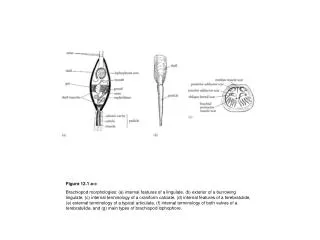
Figure12.1 a-c Brachiopod morphologies: (a) internal features of a lingulate, (b) exterior of a burrowing lingulate, (c) internal terminology of a craniform calciate, (d) internal features of a terebratulide, (e) external terminology of a typical articulate, (f) internal terminology of both valves of a terebratulide, and (g) main types of brachiopod lophophore.
Figure12.1 d-g Brachiopod morphologies: (a) internal features of a lingulate, (b) exterior of a burrowing lingulate, (c) internal terminology of a craniform calciate, (d) internal features of a terebratulide, (e) external terminology of a typical articulate, (f) internal terminology of both valves of a terebratulide, and (g) main types of brachiopod lophophore.
Figure12.2 Classification and stratigraphic distribution of the Brachiopoda. (Courtesy of Sandra Carlson.)
Figure12.3 (a) The traditional body plan with an upper dorsal and a lower ventral shell. (b) The brachiopod fold hypothesis plan implies that the brachial valve is the anterior one and the pedicle posterior – both were previously on the dorsal surface of the animal. (From Cohen et al. 2003.)
Figure12.4 Brachiopod larvae. (a) Ventral and (b) dorsal valves of the brachiopod Onniella. Black arrows indicate the anterior extent of the larval shell. Scale bars, 200 µm. (From Freeman & Lundelius 2005.)
Figure12.5 Morphological variation in Terebratalia from the San Juan islands related to changing hydrodynamic conditions. (From Schumann 1991.)
Figure12.6 Shell secretion at the margins of Notosaria. (Based on Williams, A. 1968. Lethaia1.)
Figure12.7 Representatives of the main orders of non-articulates and articulates. Non-articulates: (a) Pseudolingula (Ordovician lingulide), (b) Nushibella (Ordovician siphonotretide), (c) Numericoma (Ordovician acrotretide), (d) Dinobolus (Silurian trimerellide) and (e) Crania (Paleogene craniide). Articulates: (f) Sulevorthis (Ordovician orthide), (g) Rafinesquina (Ordovician strophomenide), (h) Grandaurispina (Permian productide), (i) Marginifera (Permian productide), (j) Cyclacantharia (Permian richthofeniid), (k) Neospirifera (Permian spiriferide), (l, m) Rostricelulla (Ordovician rhynchonellide) and (n, o) Tichosina (Pleistocene terebratulide). Magnification approximately ×2 (a, e–g, l, m), ×8 (b), ×60 (c), ×1 (d, h–k, n, o). (Courtesy of Lars Holmer (a), Michael Bassett (g), Robin Cocks (j) and Richard Grant (h, i, k, l).)
Figure12.8 Teeth of articulated brachiopods: (a) deltidiodont and (b) cyrtomatodont dentition.
Figure12.9 Brachiopod lifestyles. (Courtesy of David Harper and Roisin Moran.)
Figure12.10 Chinese lingulides: Reconstruction of the Chengjiang lingulid Xianshanella. A, anal opening; B, brachial arm; Co, cone-like organisms; Ct, cheek of trilobite; Dd, digestive tract; Dva, dorsal visceral area; Pc, pedicle cavity; St, stomach; Um?, possible umbonal muscle; Vs, setae fringing ventral valve; Vva, ventral visceral area. Scale bars, 2 mm. (From Zhang et al. 2006.)
Figure12.11 Lower Silurian depth-related paleocommunities developed across the Welsh and Anglo-Welsh region. (Based on Clarkson 1998.)
Figure12.12 Mesozoic palaeocommunities developed across Alpine Europe. Numbers 1 to 7 refer to the seven different biotypes described on the figure. (Based on Ager, D.V. 1965. Palaeogeogr. Palaeoclimatol. Palaeoecol.1.)
Figure12.13 Brachiopod predation: boring of Oichnusparaboloides in the conjoined valves of Terebratulina from the Pleistocene rocks of Barbados. Scale bar is in millimeters. (Courtesy of Stephen Donovan.)
Figure12.14 Tethyan brachiopods in East Greenland: Pygope and the proto-North Atlantic current (arrows), one of its possible migration routes. The star indicates the Lower Cretaceous, East Greenland locality.
Figure12.15 Morphology of two living bryozoans: (a) a stenolaemate and (b) a gymnolaemate. (Based on various sources.)
Figure12.16 The modular construction of a colony using Lego blocks: complex forms are generated by iteration of higher order modular units. (From Hageman 2003.)
Figure12.17 Stratigraphic ranges and absolute abundances of the main bryozoan groups. Geological period abbreviations are standard, running from Ordovician (O) to Neogene (N). (From Taylor, 1985.)
Figure12.18 Some bryozoan genera: (a) Rhabdomeson (Carboniferous cryptostome), (b) Rectifenestella (Carboniferous fenestrate), (c) Fistulipora (Carboniferous cystopore), (d) Penniretepora (Carboniferous fenestrate), (e) Archimedes (Carboniferous fenestrate), (f) Archaeofenestella (Silurian fenestrate), (g) Lunulites (Cretaceous cheilostome), (h) Castanapora (Cretaceous cheilostome). Magnification approximately ×30 (a), ×15 (b, c), ×1 (d–f), ×5 (g), ×20 (h). (a–c, courtesy of Patrick Wyse Jackson; d–h, from Taylor 1985.)
Figure12.19 Distribution of (a) cyclostome and (b) cheilostome bryozoans across the Mesozoic–Cenozoic boundary: the cheilostomes suffered the heaviest losses while the erect genera of both groups suffered more than the encrusters. (Replotted from McKinney & Taylor 2001.)
Figure12.20 (a) Cluster analysis of bryozoan growth forms across a shelf–slope transition, showing an inner shelf A (clastic dominated), inner shelf B (carbonate dominated), outer shelf and slope. The cluster analysis, using a distance coefficient (x-axis) and average group linkage, indicates the presence of four distinctive assemblages. (b) Distribution of growth forms across the onshore–offshore gradient within the assemblages identified by cluster analysis. (Based on Hageman et al. 1997.)