Download
1 / 8
80 likes | 117 Vues
Explore brain regions activated in skilled readers during visual feature detection & reading tasks. Discover differences in English & Italian readers' brain activation. Understand brain activity in dyslexic readers & contrasts between early & late-acquired words.

E N D
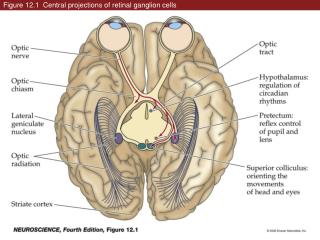
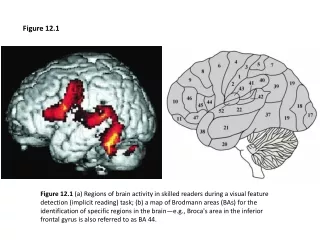
Figure 12.1 Figure 12.1 (a) Regions of brain activity in skilled readers during a visual feature detection (implicit reading) task; (b) a map of Brodmann areas (BAs) for the identification of specific regions in the brain—e.g., Broca's area in the inferior frontal gyrus is also referred to as BA 44.
Figure 12.2 Regions of common activation during reading (top row); greater activation in English readers than Italian readers during non-word reading (middle row); and greater activation in Italian readers than English readers regardless of word type (bottom row).
Figure 12.1 Figure 12.4 Regions of normal brain activation (indicated by the solid lines) and reduced activation (indicated by the dotted line) in English, French and Italian dyslexic readers during the reading of concrete nouns.
Figure 13.1 Figure 13.1 Diagram of the human brain showing the four lobar divisions.
Figure 13.2 Brain images showing contrasts between (a) early-acquired and late-acquired words (highlighting regions of greater activity when people look at words acquired early in life relative to words acquired later in life); (b) late-acquired and early-acquired words (greater activity when looking at later acquired words); and (c) low-frequency words and high-frequency words (greater activity when looking at low-frequency words relative to high-frequency words). Figure 13.2a
Figure 13.2 Brain images showing contrasts between (a) early-acquired and late-acquired words (highlighting regions of greater activity when people look at words acquired early in life relative to words acquired later in life); (b) late-acquired and early-acquired words (greater activity when looking at later acquired words); and low-frequency words and (c) high-frequency words (greater activity when looking at low-frequency words relative to high-frequency words). Figure 13.2b
Figure 13.2 Brain images showing contrasts between (a) early-acquired and late-acquired words (highlighting regions of greater activity when people look at words acquired early in life relative to words acquired later in life); (b) late-acquired and early-acquired words (greater activity when looking at later acquired words); and (c) low-frequency words and high-frequency words (greater activity when looking at low-frequency words relative to high-frequency words). Figure 13.2c
Figure 13.5 Left to right: Brain activation decreases (circled) and increases (squared outlines) in the identity, phonological and orthographic conditions. Contrasts show differences in brain activation for identity items compared to unrelated items; phonologically related items compared to unrelated items; orthographically related items compared to unrelated items; and orthographically related items compared to phonologically related items. Note that the bottom left panel depicts relatively greater activation in the orthographic condition than in the phonological condition (circled areas) and greater activation in the phonological condition than in the orthographic condition (squared outline areas). Figure 13.2c