Chart Assistant
Chart Assistant. Based upon collected process metrics data determines whether process is in control using statistical methods. Chart Assistant. On one chart plot User’s data point Mean (Am) Upper and lower natural limits (UNPL and LNPL) +1 and -1 standard deviations. Chart Assistant.
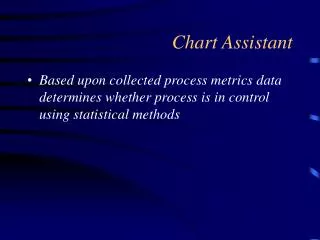

Chart Assistant
E N D
Presentation Transcript
Chart Assistant • Based upon collected process metrics data determines whether process is in control using statistical methods
Chart Assistant • On one chart plot • User’s data point • Mean (Am) • Upper and lower natural limits (UNPL and LNPL) • +1 and -1 standard deviations
Chart Assistant • On the second chart plot • Differences between consecutive data points • Mean (mR) • Upper control limit (UCL)
Chart Assistant • Process is out of control, if the following is true • single metrics values lies outside UCL • single metrics values lies outside UNPL and LNPL • 2 out of 3 consecutive metrics values lie more than 2 std. deviations away from Am • 4 out of 5 consecutive metrics values lie more than 1 std. deviation away from Am • 8 consecutive metrics values lie on one side of Am
enter data plot chart no data points entered data points entered Chart plotted screen no data entered remove all data change data Chart Assistant