Software Reliability
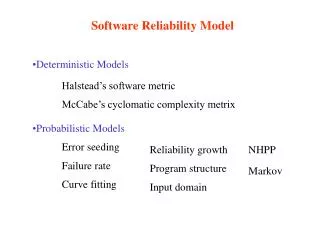
Software Reliability. Software Reliability. What is software reliability? the probability of failure-free software operation for a specified period of time in a specified environment. input. output. sw. Software reliability is part of the more general area of software quality


Software Reliability
E N D
Presentation Transcript
Software Reliability • What is software reliability? the probability of failure-free software operation for a specified period of time in a specified environment input output sw • Software reliability is part of the more general area of software quality • (high cost software development and maintenance – 90% total cost) • Measuring software reliability allows projet managers to • - estimate man-power • determine when a level of reliability has been reached
Software Reliability • Software is subject to • design flaws: - mistakes in the interpretation of the specificationthat the software is supposed to satisfy (ambiguities)- mistakes in the implementation of the specification: carelessness or incompetence in writing code, inadequate testing • operational faultsincorrect or unexpected usage faults (operational profile) input output sw
Design Faults • hard to visualize, classify, detect, and correct. • closely related to human factors and the design process, of which we don't have a solid understanding • a design flaw not discovered and corrected during testing, may possibly lead to a failure during system operation Given a design flaw, only some type of inputs will exercise that fault to cause failures. Number of failures depend on how often these inputs exercise the sw flaw Apparent reliability of a piece of software is correlated to how frequently design faults are exercised as opposed to number of design faults present
Software reliability One of the weakest links in systems reliability is software reliability. Even for control applications which usually have less complex software, it is well established that many failures are results of software bugs. Fault density: number of faults for KLOC (thousands of lines of code) Fault density ranges from 10 to 50 for “good” software and from 1 to 5 after intensive testing using automated tools[Miller 1981] . [Miller 1981]Miller E.F, et al. “Application of structural quality standards to Software”, Softw. Eng. Standard Appl. Workshop, IEEE, 1981
Software faults and Failure regions We assume that programs will not be fault-free • The input to the software is a set of variables, defining a Cartesian space, e.g. x and y Failure regions y x The software contains bugs if some inputs are processed erroneously Effcacy of software fault tolerance techniques depends on how disjoint the failure regions of the versions are
Software Reliability • Software reliability is not a direct function of time. Electronical and mechanical parts may become old, and wear-out with time and usage.Software DOES NOT wear-out during its life. Software DOES NOT change over time unless intentionally changed or upgraded • As a software is used, design faults are discovered and corrected. Consequently, the reliability should improve, and the failure rate should decrease BUT corrections could cause new faults
SOFTWARE RELIABILITY EVOLUTION • upgrades imply feature upgrades, not upgrades for reliability. From “Software Reliability”, J. Pan, Carnegie Mellon University, 1999 identify periods of reliability growth and decrease
SOFTWARE RELIABILTY EVOLUTION • in the last phase, software does not have an increasing failure rate as hardware does. In this phase, software is approaching obsolescence; there are no motivations for any upgrades or changes to the software. Therefore, the failure rate will not change. • in the useful-life phase, software will experience a drastic increase in failure rate each time an upgrade is made. The failure rate levels off gradually, partly because of the defects found and fixed after the upgrades. • Even bug fixes may be a reason for more software failures, if the bug fix induces other defects into software
Reliability upgrades drop in software failure rate, if redesign or reimplementation of some modules with better engineering approaches From “Software Reliability”, J. Pan, Carnegie Mellon University, 1999
Software Reliability Grow Models • - useful for estimating how software reliability improves as faults are detected and repaired • - used to predict when a particular level of reliability is likely to attained and also helps in determining when to stop testing to attain a given reliability level. • - help in decision making in many software development activities such as number of initial faults, failure intensity, reliability within a specified interval of time period, number of remaining faults, cost analysis and release time etc.
Software Reliability Growth Models • To achieve highly reliable software systems, many software fault detection/ removal techniques can be used by programmers or testing teams • In applying these techniques, the SRGM are important, because they can provide quite useful information for developers and testers during the testing/debugging phase
Software Reliability Growth Models • In order to estimate as well as to predict the reliability of software systems, failure data need to be properly measured by various means during software development and operational phases. • Any software required to operate reliably must still undergo extensive testing and debugging. This can be a costly and time consuming process, and managers require accurate information about how software reliability grows as a result of this process in order to effectively manage their budgets and projects. • The effects of this process, by which it is hoped software is made more reliable, can be modeled through the use of Software Reliability Growth Models (SRGMs).
Software Reliability Growth Models • Software reliability model describes failures as random process as failures are result of two processes: • - the introduction of faults - and then activation through selection of input states • These processes are random in nature. • SRGM: is generally described as the probability distribution of the value of the random process at each point in time. SRGMs are developed in general by probability distribution of failure times
Software failures • Software failures must be treated as random events • -we do not know which bugs are in the software • -we do not know when inputs will activate those bugs Siewiorek, et al Reliable Computer Systems, Prentice Hall,1992
Software Reliability Growth Models • These models provide a means of characterizing the development process and enable software reliability practitioners to make predictions about the expected future reliability of software under development. • Unfortunately, these models are often inaccurate. • These approaches are based mainly on the failure history of software and can be classified according to the nature of the failure process studied as indicated below.
Reliability growth characterization • Time between failure: the time between failure is increasing Random Variables T1, ..., Tn Ti = time between failure i-1 and failure i Reliability growth: Ti <=st Tk for all i < k Prob {Ti < x} >= Prob {Tk <= x} -> FTi(x) >= FTk(x) forall i < k and for all x Tk = time between failure k-1 and k Tk T2 T1 0 fault fault fault fault
Reliability growth characterization • Number of failure: the number of failure is decreasing Cumulative number of failure law: the number of failure events in an interval of the form [0, tk] is larger than the number of events taking place in an interval of the same length beginning later Random Variables N(t1), ..., N(tn) N(ti) = cumulative number of failures between 0 and ti x x x x x x x 0 x N(1) N(2) N(k)
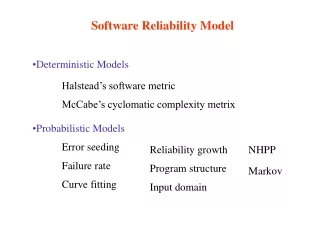
Software Reliability Growth Models Software reliability models can be grouped into:time domain, data domain, axiomatic, others Time domain models: relate software reliability to the number of bugs present in the sw at a given time during its development Removal of implementation errors should increse MTTF, and correlation of bug-removal history with the time evolution of the MTTF value may allow the prediction of when a given MTTF value will be reached. Disadvantages: Often do not consider that correct a bug may introduce new bugs Do not consider specification errors (only implementation faults)
Jelinski and Moranda Model • (the earliest and the most commonly used model) • Software failure rate is proportional to the current fault content of the program • Assume there are N faults at the beginning of the testing process • - each fault is independent of others and • - equally likely to cause a failure during testing • Detected fault is removed in a negligible time and no new faults are introduced • Let Ti denote the time between the (i-1) and the i failure • Ti follows a distribution whose parameters depend on the number of faults remaining in the system after the (i-1) failure. • Z(Ti) = f(N-(i-1)) failure rate
Schick and Wolver ton Model • Software failure rate is proportional to the current fault content of the programas well as to the time elapsed since the last failure • Z(ti) = f(N-(i-1)) ti • Failure rate is linear with time within each failure interval, return to 0 at the occurrence of a failure and increases linearly again but at a reduced slope.
Goel and Okumoto Imperfet Debbugging Model • The number of faults in the system at time t is treated as a Markov process whose transition probabilities are governed by the probability of imperfect debugging. • Times between the transitions are taken to be exponentially distributed with rate dependent on the current fault content of the system. • Failure rate during the interval between the (i-1) and the i failure • Z(ti) = (N- p(i-1)) l • - p is the probability of imperfect debugging • - l failure rate per fault
Software Reliability Growth Models • Data domain models: • Identify the sets of all input data values upon a computer program can operate • Estimate of the reliability of the program by running the program for a subset of input data values • If different subsets of all input data values are used, different reliability values for the same software system can be obtained • Nelson model • Random sampling of n inputs according to a probability distribution Pi: • The set (Pi: i=1, …, n) is the operational profile of the system • If ne is the number of inputs that resulted in execution failures the an estimate of software reiability is: • R = (1 – (ne/n))
Software Reliability Growth Models • Axiomatic models: • Software reliability ( and software quality in general) is postulated to obey some universal laws • These methods have generated great interest but their general validity has never been proved. • They give an estimate for the number of bugs present in a program • Some quantitative measures must be given: • Program clarity • Algorithm purity • Effect of modularization • Programming effort • Programming time • …………………..
Software reliability • Software Science model. The estimated number of bugs in a program is given by the expression: Siewiorek, et al Reliable Computer Systems, Prentice Hall,1992
Software reliability • Although unconventional the measured proposed are easy to compute and, in any case, it is an alternative for estimating the number of bugs in a program. • Many pubblications have eithr supported or contradicted this model. • Experimental results on some software projects Siewiorek, et al Reliable Computer Systems, Prentice Hall,1992
Software reliability • Other models: Siewiorek, et al Reliable Computer Systems, Prentice Hall,1992
Operational phase • monitoring and recording naturally occurring errors and failures in the system while it is running under user workloads • analysis of such measurements can provide valuable information on actual error/failure behaviour and all measurable dependability methrics (failure and recovery rates, reliability, availability BUT the analysis is limited to detected errors
Dependency analysis • Workload/failure dependencyworkload appers to act as a stress factor: the failure rate increases as the workload increases • Correlation among failures on different components - exsits significantly in distributed systems - for example, disk and network errors are strongly correlated,because the processors in the system heavily use and share the disk and the network concurrently - generally the error correlation is high (0.62), the failure correlationis low (0.06) Common Cause Failure a failure of two or more structures, systems or components due to a single specific event or cause
Common Cause Failure of software • Distinguishing between • CCF of the Operating System sw- a robust OS platform design with mature operating history ensures that the OS failure probability is minimal - OS fails because of interference from application sw - hypothetical failure assumed to cause a catastrophic failure of all of the processing computers • CCF of the application sw failure that may affect:- sw functions- groups of related sw functions common to redundant computer processors and share algorithms, sensor inputs, and signal trajectories OS may limit the propagation and severity of application sw CCF
Strictly cyclic operation the system is always active and processing the same amount of data -> an actual system demand puts no more stress on the OS thanany other cycle • Static memory allocation and asynchronous operations - avoid interference between OS and application program datadue to dynamic memory allocation; - avoid faults in releasing system resources and time dependencies due to internal system clock • Constant loading of communicationavoids that special loading taxes the OS capacity (e.g. increased network traffic) We obtain - predicatble OS performance - OS behaviour that is free from interference from application programs - OS failure does not depend on plant conditions
DEFENSE against application sw CCF • The software development process is robust and of high quality, • The OS platform and its software development life cycle process are mature, • Rigorous V&V methodology is used, • Configuration management after deployment is robust (including control of software versions, setpoint changes, spares), • Standardized software development tools and function libraries, • Exclusive use of pre-defined and rigorously qualified function block libraries for application programming, • Clearly defined rules for use of the software functional blocks (including exception handling), • Thorough coverage of pre-operational testing, • Comprehensive exception handling, • Deterministic program execution, • Strictly cyclic operation, and • OS defensive measures From: B. Enzinna, L. Shi, S. Yang,Software Common-Cause Failure Probability Assessment, NPIC&HMIT 2009
Software Reliability Engineering • Software Reliability Engineering (SRE) is the quantitative study of the operational behavior of software-based systems with respect to user requirements concerning reliability.
A global software reliability analysis method (In Karama Kanoun, ReSIST network of Excellence Courseware “Software Reliability Engineering”, 2008 http://www.resist-noe.org/)
Data collection process - includes data relative to product itself (software size, language, workload, ...), usage environment: verification & validation methods and failures - Failure reports (FR) and correction reports (CR) are generated • Data validation process data elaborated to eliminate FR reporting of the same failure, FR proposing a correction related to an already existing FR, FR signalling a false or non identified problem, incomplete FRs or FRs containing inconsistent data (Unusable) … • Data extracted from FRs and CRs Time to failures (or between failures) Number of failures per unit of time Cumulative number of failures
Descriptive statistics • make syntheses of the observed phenomena • Analyses Fault typology, Fault density of components, Failure / fault distribution among software components (new, modified, reused) • Analyses Relationships Fault density / size / complexity;Nature of faults / components; Number of components affected by changes made to resolve an FR .……. • Trend tests • Control the efficiency of test activities - Reliability decrease at the beginning of a new activity: OK - Reliability row after reliability decrese: OK - Sudden reliability grow CAUTION! - ....... • Model application • Trend in accordance with model assumptions
Software Reliability • Due to the nature of software, no general accepted mechanisms exist to predict software reliability • Important empirical observation and experience • Good engineering methods can largely improve software reliability • Software testing serves as a way to measure and improve software reliability • Unfeasibility of completely testing a software module:defect-free software products cannot be assured • Databases with software failure rates are available but numbers should be used with caution and adjusted based on observationand experience