Download
1 / 2
20 likes | 177 Vues
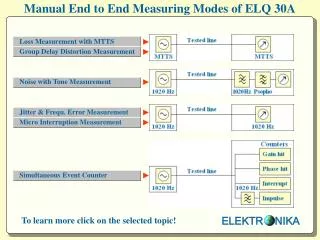
Long Time Spectrogram Measurement with ELQ 30A. The Spectrogram PC Program is an excellent tool to discover the disturbers causing considerable service impairment to communication systems. The biggest problem is that long time spectrum observation is necessary because

E N D
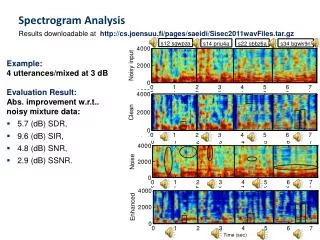
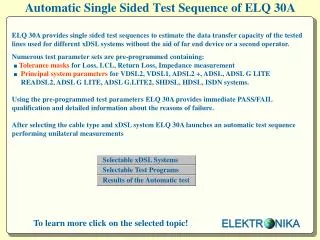
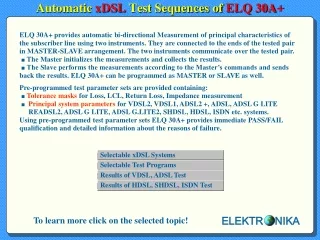
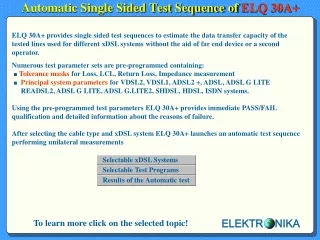
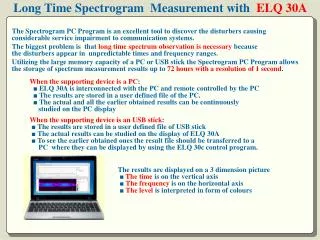
Long Time Spectrogram MeasurementwithELQ 30A The Spectrogram PC Program is an excellent tool to discover the disturbers causing considerable service impairment to communication systems. The biggest problem is that long time spectrum observationis necessary because the disturbers appear in unpredictable times and frequency ranges. Utilizing the large memory capacity of a PC or USB stick the Spectrogram PC Program allows the storage of spectrum measurement results up to 72 hours with a resolution of 1 second. When the supporting device is a PC: ■ ELQ 30A is interconnected with the PC and remote controlled by the PC ■The results are stored in a user defined file of the PC. ■The actual and all the earlier obtained results can be continuously studied on the PC display When the supporting device is an USB stick: ■The results are stored in a user defined file of USB stick ■The actual results can be studied on the display of ELQ 30A ■To see the earlier obtained ones the result file should be transferred to a PC wherethey can be displayed by using the ELQ 30ccontrol program. Theresults are displayed on a 3 dimension picture ■ The time is on the vertical axis ■The frequency is on the horizontal axis ■The level is interpreted in form of colours
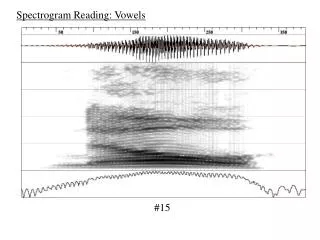
Introduction of Display Field The display field is vertically shared into two parts to show twodifferent things at the same time. For example: ■ The three dimension spectrogram (down) with a user controlled time designating white arrow ■ The measured spectrum in the user designated time (upper) ← Time Frequency ←