Download
1 / 10
100 likes | 224 Vues
This report discusses the availability and capacity of peaker engines in New Zealand, illustrating a shift from 15 to 37 peakers, enhancing total capacity from 2,500 MW to 2,960 MW. It highlights the impacts of capital expenditure (capex) on energy efficiency, with references to various peaker types, their operational costs, and the foreign currency exposure impacting overall financials. Additionally, it delves into the operational aspects of coal and gas peaking plants, including efficiency rates and carbon capture costs. The insights provided are based on data from the GTW Handbook 2009.

E N D
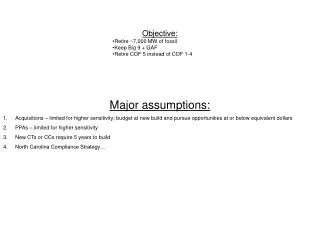
Thermal GEM assumptions Erwan Hemery 12 May 2009
Number of peakers available Engine capex and HR • Before: 15 peakers - 10 diesel and 5 gas, total capacity = 2500 MW • Now: 37 peakers - 24 diesel and 13 gas, total capacity = 2960 MW • The capex decreases with the installed capacity and the capex increases with the efficiency – intercool system 15-20% more expensive Reference: GTW handbook 2009
Peakers details Diesel peakers Location: Marsden, Otahuhu, Huntly, Port Maunganui, Whirinaki, New Plymouth, Gracefield and Islington. Gas peakers Location: Stratford, Southdown, Otahuhu, and Huntly. • Assumptions: 80 % of the total cost is exposed to foreign currency • e.g. LMS100 US$709/kW at exchange of 0.8 = NZ$886/kW + 20% for local cost = NZ$1063/kW • at exchange of 0.5 = NZ$1418/kW + 20% for local cost = NZ$1701/kW
Peakers O&M costs • Average is presented above but fixed and variable O&M would differ between engine size and type (decrease vs capacity and more expensive for diesel engine) • For the gas engine an extra $2/GJ is added on the top of the gas price to reflect gas flexibility
CCGT Reference: GTW handbook 2009 and GE website
CCGT details • Assumptions: 80 % of the total cost is exposed to foreign currency • e.g. US$600/kW at exchange of 0.5 = NZ$1200/kW + 20% for local cost = NZ$1440/kW
Coal Assuming exchange rate of 0.6 for the triangles • O&M coal should be ~$100/kW instead of $40/kW • Adjust Coal/Lignite capex price as the CCGT capex has been changed : roughly 2.33 times more expensive than CCGT (~ $NZ 3300/kW)
Coal and Lignite HR • HR values in GEM average at 10,000 GJ/GWh (36 %)…this is true for existing subcritical (180 bar, 540 oC) • New subcritical coal plant with conventional environmental controls operate closer to 39% efficiency • Supercrital steam-cycle (240 bar, 570 oC) have become the system of choice in Europe and USA and have efficiency in the range of 42% to 45%. • IGCC and ultra-supercritical plants could have 50% efficiency Coal HR in GEM: 8600 GJ/GWh (42 %) Lignite HR in GEM: 9300 GJ/GWh (39 %)
CCS • Before we had a gain in efficiency but that’s the opposite there is a loss in efficiency caused by the capturing ~ 10% less then a standard Coal • CCS cost has been set to twice the price of standard coal (IEA,2006) – cheaper in the future? • Calculation shows that CCS break even with Coal at a carbon charge of $110/t (good agreement with IEA). • IEA says in the future break even could be at ~$NZ 90/t roughly equivalent to a 10% decrease of capex • …in the base case ($75/t) we need to drop the capex by 25% to built CCS instead of Coal or set the carbon charge higher (do we want Coal generation in the TTER base case?) • CCS has been set to $US 2800/kW
Pipeline costs • Rough calculation to add an extra concost to the gas fired station depending on their location (steady state isothermal gas flow model) • Sfd and Hly no gas concost • Swn, Ota and hpi required gas concost • Set all the potential CCGT and OCGT to max offtake and remove the constraint – get the diameter and the total cost (based on ITL costs estimate) • Need to extent the Maui pipeline (750 mm) to Ota. • Split the total cost (fraction of the volume used for each power station) for the 1st 80 km • For hpi an extra 40 km of 350 mm pipeline is required and half of the cost goes to 240 MW Rodney 1 and 240 MW Rodney 2. CCCT $m 20-30 OCGT $m 8-15