Download

1 / 22
230 likes | 360 Vues
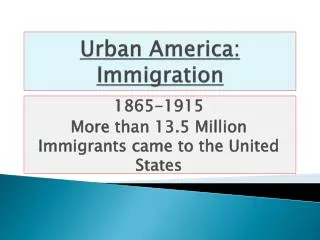
Urban Form in America and Europe. Pietro S. Nivola Senior Fellow Governance Studies The Brookings Institution. Fundamentals. Space. Source: Center for International Earth Science Information Network, Columbia University. Demography Population Growth. Source: OECD. Demography.

E N D
Urban Form in America and Europe Pietro S. Nivola Senior Fellow Governance Studies The Brookings Institution
Fundamentals • Space Source: Center for International Earth Science Information Network, Columbia University
Demography • Population Growth Source: OECD
Demography • Demography • Age Profile Source: OECD
New County, Same State (19%) Within County (65%) Different State (13%) International (3%) • Demography • Mobility Over one in ten Americans moved in 2008 (38.7 million people) Mobility patterns: Source: US Census Bureau
Per Capita Gross Domestic Product (inflation adjusted USD) • The Economy • GDP Source: OECD
Policy Distinctions • Agricultural Subsidies Source: OECD
Allocation of Transportation Spending (as share of total ground transportation spending) United States Untied Kingdom Roads and Road- Related Expenses Public Transit Public Transit Roads and Road-Related Expenses • Transportation Policy Source: US Department of Transportation, UK Department for Transport
Unleaded Gas Prices and Taxes (2008, Q1) • Energy Prices and Taxes Source: The Brookings Institution
Automotive Diesel Prices and Taxes (2008, Q1) • Energy Prices and Taxes Source: The Brookings Institution
Electricity Prices for Households (U.S. Dollars per Kilowatt-hour) • Energy Prices and Taxes Source: OECD
Percent of Trips Taken by Various Modes of Transportation Source: Sprawl in Europe and America, Michael Lewyn, 46 San Diego L. Rev. 85
Vehicle Kilometers Driven (per capita, 2003) 8829 6286 6299 6313 Source: Transportation: A Geographical Analysis, by William Richard Black, pp. 39
Per Capita Education Expenditure (Annual expenditure per student, in USD) • Education Source: US Department of Education
Source: The Programme for International Student Assessment (PISA), 2006.
MCAS Composite Over 95% 90-95% 80-89% Under 80% Sources: The New York Times, Mass. State Board of Education
Energy Consumption: Total energy consumption per capita Units: Kilograms of oil equivalent (kgoe) per person 9,000 8,000 7,000 6,000 5,000 4,000 3,000 2,000 1,000 0 1990 2000 2005 France Germany Italy United Kingdom United States So What? • Big Foot Source: IEA Statistics Division, Energy Balances of OECD Countries (2008 edition).
Carbon Footprint: International Comparison Carbon dioxide emissions (CO2), metric tons of CO2 per capita (UNFCCC) Source: United Nations
What To Do? • Shopworn “Solutions” • Emulate Europe? No and Yes