Enhancing Disease Surveillance Feedback Program for District Officers
Explore the Importance of Data Feedback in Integrated Disease Surveillance Programs, with Case Studies and Recommendations for Better Surveillance Systems and Reporting Processes. Identify Challenges, Methods, and Benefits of Feedback Mechanisms.

Enhancing Disease Surveillance Feedback Program for District Officers
E N D
Presentation Transcript
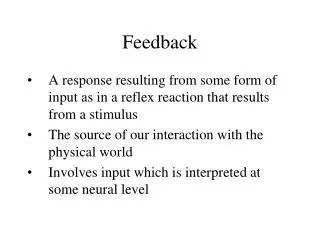
Feedback Integrated Disease Surveillance Programme (IDSP) district surveillance officers (DSO) course
Preliminary questions to the group • Were you already involved in feedback of surveillance data? • If yes, what difficulties did you face? • What would you like to learn about feedback of surveillance data? 2
Warm up exercise • Diphtheria persists in Delhi • One hospital used at a sentinel centre • Data analyzed from 1954-1997 3
Diphtheria incidence and case fatality, sentinel unit, New Delhi, India, 1954-97 1800 40% 1600 Cases 35% Case fatality 1400 30% 1200 25% 1000 Number of cases Case fatality 20% 800 15% 600 10% 400 5% 200 0 0% 4 1954 1956 1958 1960 1962 1964 1966 1968 1970 1972 1974 1976 1978 1980 1982 1984 1986 1988 1990 1992 1994 1996 Year
Diphtheria incidence by month, sentinel unit, New Delhi, India, 1997 35 Cases 30 Deaths 25 20 Number of cases 15 10 5 0 5 J F M A M J J A S O N D Month
Characteristics of diphtheria cases, sentinel unit, New Delhi, India, 1997 * Account for 9%, 17% ad 5% of the population in Delhi, UP and Haryana 6
Questions for the group:Propose messages for feedback • Describe what you see • Recommend action to report in your feedback bulletin 7
Key findings messages re: diphtheria in Delhi, India,1997 • Incidence decreases • Case fatality increased • Seasonality: • August to October • Most cases among unvaccinated, at at age when they should be protected from primary vaccination 8
Key recommendations re: diphtheria in Delhi, India,1997 • Increase vaccine coverage and reach unvaccinated pockets • Store and use anti-toxin early 9
Outline of the session • Rationale for feedback • Content of feedback • Feedback mechanisms Group exercise to conclude 10
Difficulties with surveillance system with no feedback • Lack of motivation • Data disappear in a black hole • Unreliability • Mistakes are not corrected • Sluggishness • The various levels do not communicate • Data falsification • The data is opaque • Weak human resources • The actors do not see the system in action 11
Rationale for feedback of surveillance data • Motivation • Everyone sees how their data fit in the bigger picture • Reliability • Identifies errors • Reactivity • Places everyone on the same page • Quality • Increases transparency • Education • Demonstrates how the system works 12
Collect and transmit data Make decisions Analyzedata Feedbackinformation A dynamic vision of surveillance All levels use information to make decisions 13 Surveillance
Data flow and feedback: Level by level Centre State Feedback Data District Primary / Community health centre Community 14
Content of feedback • Information on diseases under surveillance • Information on quality of data collected 15
Content of feedback • Information on diseases under surveillance • Summary data tables • Analyzed epidemiological information • Time (Graphs with trends) • Place (Maps) • Persons (Tables) • Information on quality of data collected 16
Content of feedback • Information on diseases under surveillance • Information on quality of data collected • Regularity of reporting • Timeliness of reporting • Completeness of reporting • Responses initiated by the unit • Validity of data 17
Feedback methods • Newsletters, bulleting • Monthly review meetings • Outbreak investigation reports • Informal feedback • Electronic communication 18
Newsletter • Regular epidemiological bulletin • Educational tool • Contains • Summary tables and graphs • Commentary on diseases or topic 19
Monthly review meetings • District / block monthly meeting • Presentation of data during meetings • Generates comments from peers • Need to stress positive aspects • Public negative comments may de-motivate 20
Outbreak investigation reports • Excellent for feedback and learning • Allow sharing of experiences that may be encountered in other places • Content • Information about the epidemiological characteristics of disease • Lessons learned in the investigation process 21
Informal feedback • Oral feedback • Useful for pointing out mistakes • Does not suffice by itself 22
Electronic methods • Through email, websites • Fast and efficient • May be updated rapidly • Allows • Dynamic data presentation • Queries 23
Take home messages • Feedback closes the surveillance loop • Feedback • Epidemiological information • Time • Place • Person • Information on data quality • Use all possible mechanisms of feedback to get the information across 24
Exercise • Read the article on the analysis of measles surveillance data in Uttar Pradesh in 1996 • Singh J. et al. Widespread outbreaks of measles in rural Uttar Pradesh, India, 1996: High risk areas and groups. Indian Pediatrics 1999; 36: 249-255. • Imagine you need to prepare a feedback meeting with health officials in Uttar Pradesh • You need to prepare a presentation 25
Group work • Sit down by by groups of 4 or 5 • Extract information from the article to structure your feedback • Use a table format to prepare your presentation 26
Break in groups Take 15 minutes
Key elements of feedback for measles in Uttar Pradesh, India, 1996 29
Presenting your feedback • Present the background • Explain how you collected the data • Display the key results presented in the summary table • Back up data with tables, graphs and maps • Interpret the data • Summarize the recommendations that can be deducted from the data 30
Additional reading • Section 4 of IDSP operations manual (Report 2-7, page 57-64) • Section 10 of IDSP operations manual • Module 10 of training manual 31