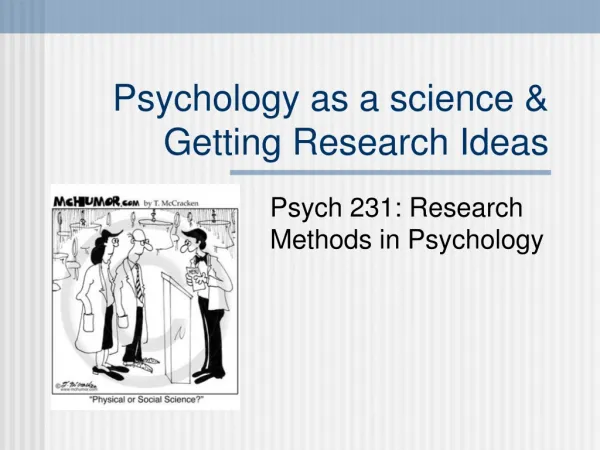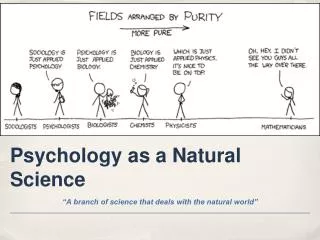
Psychology as a Science
430 likes | 819 Vues
Psychology as a Science. In this discussion we will explore: limits of common sense science - a method for understanding methods of science description correlation experimentation evaluating data with statistics sources of error and bias in research. How do we know things?.

Psychology as a Science
E N D
Presentation Transcript
Psychology as a Science • In this discussion we will explore: • limits of common sense • science - a method for understanding • methods of science • description • correlation • experimentation • evaluating data with statistics • sources of error and bias in research
How do we know things? • ‘We Just Know It’ – Intuition or Common Sense OR • Tried and True Science Can we trust our intuition?
Science vs. Common Sense Why don’t we rely on intuition (common sense)? • 1. Hindsight Bias – tendency to believe, after learning an outcome, that one would have foreseen it. • To find out something has happened, makes it inevitable – I Knew It All Along Phenomenon
Why don’t we rely on intuition (common sense)? • 2. Overconfidence – we tend to think we know more than we do • Humans are usually more confident than correct. Try these anagrams: WREAT ETRYN GRABE OCHSA
Why don’t we rely on intuition (common sense)? Water Entry Barge Chaos • Once people know the target word, hindsight makes the words obvious. We believe that we should have seen the solution in a shorter period of time.
Science vs. Common Sense • Common sense and intuition often tell us about psychology • e.g., suppose a study tells us that ‘separation weakens romantic attraction’ • common sense may tell us - “out of sight, out of mind” • or common sense may say the opposite - “absence makes the heart grow fonder” • Common sense can be inconsistent and based on hindsight
Science vs. Common Sense • Science helps build explanations that are consistent and predictive rather than conflicting and postdictive (hindsight) • Science is based on • knowledge of facts • developing theories • testing hypotheses • public and repeatable procedures
Scientific Inquiry/Research • Facts are what need to be explained • objective - viewable by others • based on direct observation • reasonable observers agree are true • Theory is a set of ideas that • organizes facts • makes predictions about observations (new facts) • Hypothesis • prediction about new facts (often implied by theory) • can be verified or falsified
Scientific Inquiry/Research As a check on their bias, psychologists report their findings with – • Operational Definitions (of Concepts): a statement of the procedures used to define research variables Operational Definitions allow others to replicate the study (repeating the essence of the study to get similar results).
Research Methods in Psychology • Setting - field vs. laboratory • Methods of data collection • self-report vs. observational • Research plan or design • descriptive • correlational • experimental
Descriptive Research • Describes a set of facts • Doesnot look for relationships between facts • Doesnot predict what may influence the facts • May or may not include numerical data • Example: measure the % of new students from out-of-state each year since 1980
Descriptive Research • Types of descriptive research • Case Study In-depth study of one individual • Naturalistic Observation Recorded observation of people or animals in their natural environment – focus on a specific behavior • Survey
Surveys • Wording Effect - need to watch for bias, order of wording, too general (attractiveness, intelligence) • Sampling • False Consensus Effect – tendency to overestimate other’s agreement with us • Creates the need for a representative sample of the population
Surveys • Sampling Cont’d. • Population – all the cases in a group, from which samples may be drawn for a study (e.g. study on studying habits – population would be all students) • Random Sample – sample in which every person in a group has equal chance of participating
Correlational Resarch • Collects a set of facts organized into two or more categories • measure parents disciplinary style • measure children’s behavior • Examines the relationships between 2 or more categories e.g., more democratic parents have children who behave better
Correlational Research • Correlation CANNOT prove causation • Do democratic parents produce better behaved children? • Do better behaved children encourage parents to be democratic? • May be an unmeasured common factor • e.g., good neighborhoods produce democratic adults and well behaved children
Correlational Research • Scatterplots – graphed cluster of dots, each of which represents the values of two variables • See pg. 27 for examples • Correlation Coefficient – a statistical measure of relationship • Statistical measure of the extent to which two factors vary together, and thus of how well either factor predicts the other.
Direction of a Correlation (slope of the points) • Positive Correlation – as one variable goes up, the other variable tends to go up (so as one goes down, the other goes down) – max. +1.00 • Negative Correlation – as one variable goes up, the other tends to go down, the inverse is also true – min. -1.00 • No Correlation – correlation is 0.0
Strength of Correlation (amount of scatter) • The higher the correlation coefficient is (without regard to sign) the stronger the correlation is. • The stronger the correlation is, the better one variable can predict the other.
Correlational Research Correlations make visible relationships that we might otherwise miss. They also restrain our “seeing” relationships that actually do not exist – illusory correlations – perception of a relationship where none exists (e.g., superstitious beliefs) Believe – likely to notice and recall
Perceiving Order As humans we want to make sense of our world, so we look for meaningful patterns. Prob – Random sequences often don’t look random – leads to illusory corr. If someone flipped a coin six times, which of the following sequences of H and T would be most likely? HHHTTT HTTHTH HHHHHH
Correlational Research A little note about correlation – CORRELATION DOES NOT PROVE CAUSATION!!
Experiments • Direct way to test a hypothesis about a cause-effect relationship between variables • One variable is controlled by the experimenter • e.g., democratic vs. authoritarian classroom • The other is observed and measured • e.g., cooperative behavior among students
Experimental Variables • Independent variable • the controlled factor in an experiment – what the experimenter manipulates • hypothesized to cause an effect on another variable • Dependent variable • the measured facts/data • hypothesized to be affected
Independent Variable • Must have at least two levels • categories - male vs. female • numeric - ages 10, 12, 14 • Simplest is experimental vs. control • experimental condition gets treatment (e.g., gets the new drug) • control condition does not (e.g., gets the placebo) (created when using a double-blind procedure)
Experimental Design • Levels may differ between or within people • Within-subject experiment - different levels of the independent variable are applied to the same subject • Between-groups experiment - different levels of the independent variable are applied to different groups of subjects
Experimental Design • Random sample - every member of the population being studied should have an equal chance of being selected for the study • Random assignment - every subject in the study should have an equal chance of being placed in either the experimental or control group • Randomization helps avoid false results
Experimental Design Validity – extent to which a test measures or predicts what it is supposed to Internal Validity – controlled for confounding variables (if random assignment is violated, can destroy internal validity) External Validity – generalizability (if random sample is violated, can destroy external validity)
Sources of Bias • Observer-expectancy effect • researcher has expectations that influence measurements • Subject-expectancy effect • subject knows design and tries to produce expected result • Blinding • minimize expectancy by removing knowledge about experimental conditions
Blinding • Single-blind study - when subjects are kept uninformed as to the treatment they are receiving • Double-blind study - when both subjects and experimenter are kept uninformed about aspects of the study that could lead to differential expectations
Double Blind Procedures Double Blind Procedures allow researchers to check for a treatment’s actual effects apart from the placebo effect – - experimental results caused by expectations alone; such as a research participants’ enthusiasm for it or the healing power of belief
Sources of Bias Confounding Variables - • Any variable besides the independent variable that affects the dependent variable in one group but not the other. (e.g., placebo takes a study skills seminar, non random assignment)
Research Settings • Laboratory • a setting designed for research • provide uniform conditions for all subjects • permits elimination of irrelevant factors • may seem artificial • Field research • behavior observed in real-world setting • poor control over conditions • measures may be more representative of reality
Data-Collection Methods • Self-report - procedures in which people rate or describe their own behavior or mental state • questionnaires • rating scales • on a scale from 1 to 7 rate your opinion of … • judgements about perceptions • on a scale from 1 to 100 how hot is ...
Data-Collection Methods • Observational methods - researchers directly observe and record behavior rather than relying on subject descriptions • naturalistic observation - researcher records behavior as it occurs naturally • tests - researcher presents stimuli or problems and records responses
Data-Collection Methods • Cross-Sectional Studies –study in which subjects of different ages are compared at a given time • Longitudinal Studies – study in which subjects are followed and periodically reassessed over a period of time
Data-Collection Methods • Meta-Analysis – combine and analyze data from many studies; it determines how much of the variance in scores across all studies can be explained by a particular variable