Download
1 / 22
220 likes | 328 Vues
Learn how to calculate standard deviation, find p-values, interpret evidence levels, and reject null hypotheses with ease. Walk through critical regions, type I and II errors, and forming conclusions in hypothesis tests.

E N D
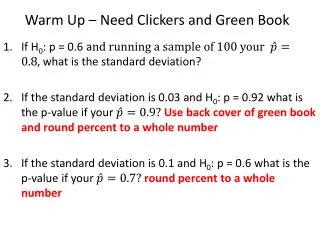
Warm Up – Need Clickers and Green Book If H0: p = 0.6 awhat is the standard deviation? If the standard deviation is 0.03 and H0: p = 0.92 what is the p-value if your Use back cover of green book and round percent to a whole number If the standard deviation is 0.1 and H0: p = 0.6 what is the p-value if your round percent to a whole number
How do you find the p-value? P-value the probability that could occur if Ho was correct 1. Find 2. Find standard deviation: use p from H0 3. Find the z-value: use standard dev. from H0 4. Find P-value:use z and look up on the z-table
Interpreting the p-value… Overwhelming Evidence (Highly Significant) Strong Evidence (Significant) Weak Evidence (Not Significant) No Evidence (Not Significant) 0 .01 .05 .10
When do you reject Ho? Significance Level Choose the significance level = reject Ho if P confidence level is 95% reject Ho if P confidence level is 99% P : then reject Ho Reject H0 Fail to reject H0 Signficance Level () Critical region
Rejection Region for different HA a Level of significance = a a /2 /2 HA: μ≠ Rejection region is shaded Two-tail test 0 a HA: μ > 0 Upper-tail test a HA: μ < Lower-tail test 0
State Hypothesis (H0 & HA) • Check conditions • Data: p-hat, stdev, n • Analysis: Find P-value & draw normal curve • Conclusion: Reject H0 if P-value is small (statistically significant) Hypothesis Test: Does the person who is older win more plays at war than the younger person?
Classwork green book page 521 #24-27 Complete for homework
Critical Region: • ISet of all values of the test statistic that would cause a rejection of the null hypothesis Significance level: Critical Region
Critical Region • Set of all values of the test statistic that would cause a rejection of the • null hypothesis Critical Region
Critical Region • Set of all values of the test statistic that would cause a rejection of the null hypothesis Critical Regions
Definition CriticalValue: is the value (s) that separates the critical region from the values that would not lead to a rejection of H0
Critical Value Value (s) that separates the critical region from the values that would not lead to a rejection of H0 Critical Value ( z score )
Critical Value Value (s) that separates the critical region from the values that would not lead to a rejection of H0 Reject H0 Fail to reject H0 Critical Value ( z score )
Controlling Type I and Type II Errors • a, ß, and n are related • when two of the three are chosen, the third is determined • a and n are usually chosen • try to use the largest a you can tolerate • if Type I error is serious, select a smaller a value and a larger n value
Conclusions in Hypothesis Testing • always test the null hypothesis 1. Fail to reject the H0 2. Reject the H0 • need to formulate correct wording of finalconclusion
Warm up What do all of these phrases have in common: The finding is significant at the 0.05 level. The confidence level is 95 percent. The Type I error rate is 0.05. The alpha level is 0.05. α = 0.05. There is a 1 in 20 chance of obtaining this result (or one more extreme). The area of the region of rejection is 0.05. The p-value is 0.05. p = 0.05.
FIGURE 7-2 Wording of Conclusions in Hypothesis Tests Original claim is H0 (This is the only case in which the original claim is rejected). “There is sufficient evidence to warrant rejection of the claim that. . . (original claim).” Yes (Reject H0) Do you reject H0?. No (Fail to reject H0) “There is not sufficient evidence to warrant rejection of the claim that. . . (original claim).” Original claim is H1 (This is the only case in which the original claim is supported). Yes (Reject H0) “The sample data supports the claim that . . . (original claim).” Do you reject H0? No (Fail to reject H0) “There is not sufficient evidence to support the claim that. . . (original claim).”
Type I Error • The mistake of rejecting the null hypothesis when it is true. • The probability of doing this is called the significance level, denoted by a(alpha). • Common choices for a: 0.05 and 0.01 • Example: rejecting a perfectly good parachute and refusing to jump
Type II Error • the mistake of failing to reject the null hypothesis when it is false. • denoted by ß (beta) • Example: failing to reject a defective parachute and jumping out of a plane with it.
Table 7-2 Type I and Type II Errors True State of Nature The null hypothesis is false The null hypothesis is true We decide to reject the null hypothesis Type I error (rejecting a true null hypothesis) Correct decision Decision We fail to reject the null hypothesis Type II error (failing to reject a false null hypothesis) Correct decision