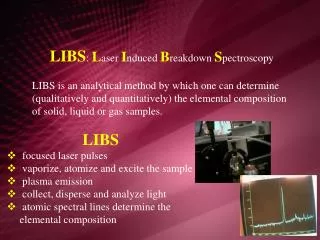
LIBS
LIBS. Analýza složení artefaktů Monitorování laserového čištění. Konzervace dřeva. Microscope pictures of penetration hole (left) and section of the penetration channel (right) after 450 laser shots, pulse energy 55 mJ.


LIBS
E N D
Presentation Transcript
LIBS Analýza složení artefaktů Monitorování laserového čištění
Konzervace dřeva Microscope pictures of penetration hole (left) and section of the penetration channel (right) after 450 laser shots, pulse energy 55 mJ. Echelle spectrum of wood containing chromium-copper-boron, Uncorrected camera picture (on-chip addition of 10 shots), spectral range 245-700 nm.
Change of wood preserver distribution with penetration depth, pulse energy 50 mJ, 5-shot averaging mode..
Monitoring odstraňování starých nátěrů To manually remove wax from canvas or wood is time-consuming. Using a laser, it can be easily automated using LIBS-detection. The LIBS spectra from the wax show clear CO and CN bands. As soon as the underlying layer is hit, a peak appears at 423 nm. A simple selection criterion was defined in the software, telling the laser to stop firing at the moment that the peak at 423 nm emerged. LIBS spectra are shown of pure wax, plywood and the point where the laser just hits the wood.
Pigmenty LIBS spectra from a homogenized mixture of pigments containing lead white, cadmium red, and ultramarine blue. Laser wavelength: 266 nm. LIBS spectra of lead white oil color (lead white/linseed oil). The inset shows the spectrum of pure lead white powder. Laser wavelength: 1064 nm.
LIBS spectra from (a) cadmium yellow lemon (Cd0.9Zn0.1S´BaSO4)Ð the asterisks indicate emission lines due to zincÐ and (b) chrome yellow (PbCrO4). Laser wavelength: 1064 nm. LIBS spectra from (a) cadmium red (CdSe0.3S0.7) and (b) vermillion (HgS). Laser wavelength: 1064 nm.
19th c. Russian icon of St. Nicholas. Successive LIBS spectra indicating the separation of paint layers (top spectrum) and ground layer (bottom spectrum) by silver foil (middle spectrum). The paint layer contains an iron-based pigment (brown, and so, probably an iron oxide) and the ground is calcium sulfate.
Sledování restaurátorských zásahů LIBS spectra from original paint and from paint in restored areas of the oil painting.
Malované omítky Photograph of a typical painted plaster sample (Thebes sample, Greece). Fragmentary wall painting from Palaikastro, Crete, representing blue and green plant motifs.
LIBS spectra of blue paint on plaster samples from (a) Thebes (sample THC 2); emission lines e Cu: 324.75 nm, 327.40 nm; Si: 263.13 nm, 288.16 nm; Mg: 279.5 nm, 280.27 nm, 285.21 nm; Ca: 299.50e300.92 nm, 315.89 nm, 317.93 nm; Al: 308.22 nm, 309.27 nm and (b) Palaikastro (sample PK 62); emission bands from iron in the range of 258e264 nm, 271e275 nm and 300e305 nm.
LIBS spectrum from green coloured sample from Thebes (THA 2b). Emission lines e Mg: 279.5 nm, 280.27 nm, 285.21 nm; Si: 263.13 nm, 288.16 nm; Al: 308.22 nm, 309.27 nm; Ca: 299.50e300.92 nm, 315.89 nm, 317.93 nm; Cu: 324.75 nm, 327.40 nm. Inset: first (a) and second (b) pulse LIBS spectra indicating weak emission of Fe in the first and increase of silicon emission in the second. LIBS spectrum from dark red/purple coloured sample from Palaikastro (PK 64) indicating strong emission features from Fe: 258e264 nm, 271e 275 nm, 293e302 nm, 321e323 nm; and distinct emission lines from Mg: 279.5 nm, 280.27 nm, 285.21 nm; 288.16 nm; Si: 288.16 nm; Al: 308.22 nm, 309.27 nm Al: 308.2 nm, 309.27 nm.
Kovy a slitiny LIPS spectral signal collected during the analysis of the Au alloy. Specic lines emitted by Au, Ag and Cu atoms are marked.
LIBS spectra of an ancient Greek dagger handle found on the tiny island of Pseira showed an intense light emission characteristic of a silver coating. Using LIBS revealed traces of silver on a wooden dagger-handle found on the island of Pseira. for silver-on-bronze decorative coating was available during the late-Minoan period (around 1600 BC). ( Nd:YAG laser operating at the fundamental 1064 nm wavelength was set to emit 15 ns pulses of 3-5 mJ per pulse).
Calibration curves for Zn in the ternary and quaternary bronze alloys studied for nanosecond and femtosecond excitation. The line of ZnI at 334.55 nm was normalized with respect to the line of CuI at 296.12 nm. Calibration curves for Sn in all the bronze alloys studied for nanosecond and femtosecond excitation. The line of SnI at 286.33 nm was normalized with respect to the line of CuI at 296.12 nm.
Comparison between the spectra produced by the laser at 355 nm and those produced by the laser at 1,064 nm. From top: magnifications of the UV, visible and IR spectral regions, respectively
Čištění kamene Picture of a cross-section of a speleothem showing a external alteration layer and speleothem bedrock labeled as 1 and 2, respectively. A laser-induced breakdown spectrum of the alteration layer (solid line) compared with the speleothem bedrock (gray line) is also presented.
LIBS spectra in the spectral region from 245 to 310 nm obtained by two laser pulses each on the black crust and the laser-cleaned region. LIBS spectra in the spectral region from 310 to 385 nm obtained by two laser pulses each on the black crust and the laser-cleaned region.
The LIBS spectra of the ablated material from a dendritic crust at different depths from the surface and un-weathered Pentelic marble, normalized to the intensity of Ca II line at 317.93 nm. LIBS spectra in the spectral region from 240 to 380 nm obtained by the second, eighth, fourteenth, and twenty-second laser pulse on the black crust.
Papír An example of a single shot spectrum of kaolin CaCO3 coated paper.
Keramika Neolitická malovaná keramika (Itálie)
Discriminating plot of variables V1 = 1− RA vs. V2 = RG − RH. Pottery samples are clustered into three well-separated groups. Ellipses correspond to the 90% confidence level LIP spectra in the region from 260 nm to 340 nm obtained by 355 nm-laser irradiation on (a) Hispanic sample, H5 and (b) Gaulish sample G3
Kosti a zuby One-dimensional measurement map for the ratio of Mg content to Ca content, for a section of a caries-infected tooth. The increased Mg concentration clearly identifies the part of the tooth ‘softened’ by caries.
Autenticita výrobků z korálu korál vs. vápenec
LIF spectra of unvarnished tempera systems taken at a resolution of 1 nm with a laser fluence of 1.2 mJ cm-2: (a) zinc white, (b) cinnabar, (c) Naples yellow, and (d) lead chromate. The exciting laser wavelength is 248 nm. (e) UV fluorescence image of a cross section of an unvarnished laser-ablated region of a Naples yellow tempera sample. (Magnification is 500).
Pojiva v malbách Fluorescence excitation spectrum (390 nm) (emission maxima at 290 nm and 330 nm), and excitation spectrum (emission maximum 385 nm) from 0.1% (w/w) aqueous solution of rabbit skin glue. Wavelength dependence of fluorescence emission from films of egg white (excitation at 248 nm, emission maximum 340 nm; excitation at 355 nm, emission maximum 420 nm).
Detekce mikroorganismů Fluorescence spectra of green algae on a marble substrate. Before a biocidal treatment (continuous line) and after (dotted line). Excitation wavelength 355 nm. Normalised LIF spectra of green algae (continuous line) and cyanobacteria (dotted line). Excitation 355 nm.
Fluorescence image related to the alga colonisation on the northern portal of Lund Cathedral. The intensity of the chlorophyll fluorescence in the band around 685 nm is indicated in grey levels and makes evident the important biodeteriogen colonisation on the stone surface.
Fluorescence spectra of Ho¨ o¨ r sandstone from the external walls of Lund Cathedral: 1) 12th century stone; 2) 19th century stone; 3) 12th century stone with algae. Excitation 337.1 nm. The same behaviour was observed in the remote measurements with the excitation at 355 nm.
Katedrála v Parmě a a picture of the area investigated; b the thematic map obtained from the ratio between the integrated area in the range 396 to 408 nm and the integrated area in the range 409 to 450 nmn (the yellow-red areas in the image indicate areas subject to protective treatment); c fluorescence spectra taken from the bottom left area of the protiro and referring to those pixels of the thematic map in b where the protective treatment was strongly present (yellow–red pixels); and d fluorescence spectra taken in the bottom right area of the protiro where the protective treatment is present in a lower degree
Znečištění kamene LIF spectra of Paros marble clean and encrusted surface: laser exc. at 266nm (left) and 355nm (right)