IPS tomography IPS-MHD tomography
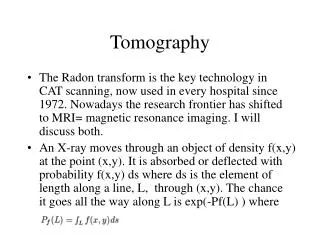
IPS tomography IPS-MHD tomography. However because of the line-of-sight integration effect of IPS, solar wind had to be studied with blurred images. In order to deconvolve the line-of-sight integration effect, Computer Assisted Tomographic (CAT) method was developed.

IPS tomography IPS-MHD tomography
E N D
Presentation Transcript
However because of the line-of-sight integration effect of IPS, solar wind had to be studied with blurred images. In order to deconvolve the line-of-sight integration effect, Computer Assisted Tomographic (CAT) method was developed. Since Hewish et al. reported the discovery of the interplanetary scintillation (IPS) phenomena in 1964, the IPS method has been one of the few devices which can observe solar wind in three-dimensional space. Although the solar wind is extended radio scattering medium, old IPS analysis method assumed that the IPS observes the solar wind at a P-point where radio scattering is mostly weighted.
Baseline length189 km Fresnel radius 90km After Breen et al., 1996
Baseline length239 km Fresnel radius 90km After Breen et al., 1996
★ Sun High-speed SW Low-speed SW Earth
Cross correlation 0 Lag time Long base line observation Resolve into fast and slow winds
Since the baselines of STELab system are as short as Fresnel radius, STELab cannot resolve solar wind structure. However ….. STELab 327MHz RF=150 km base line =100km EISCAT 930MHz RF= 90km base line = 380 km
Both solar rotation and solar wind outward motion provide us a large number of lines of sight, with which we can obtain perspective views of three dimensional solar wind structures. Using these large number of lines of sight, we can apply Computer Assisted Tomography for IPS analysis. This technique can retrieve not only unbiased solar wind parameters but also provides high spatial resolution.
SW Born 近似 In conditions of weak scattering, the IPS observations can be mathematically represented using the Born approximation in which the observed diffraction pattern is regarded as a weighted sum of contributions from each thin scattering layer perpendicular to the line of sight.
Corotating tomography • Time sequence tomography • Two-spheres tomography • MHD-IPS tomography • Time-dependent tomography
Corotating tomography • Synoptic map of one rotation • Stable solar wind structure
Corotating tomography longitude
Corotating tomography CT Analysis
Time sequence tomography • Continuous synoptic map through a year • Metastable solar wind
Time sequence tomography Comparison of Ulysses and IPS Observations 1995 Red: IPS Black: Ulysses 2001
Two-spheres tomography • R dependence of SW structure
0.3-0.9 AU 80o 50o 50o 80o 0.1-0.3 AU
80o 50o 50o 80o
14 data sets 14 data sets
MHD-IPS tomography • IPS observations are used as outer boundary conditions. • Not only V and N but also T and B are obtained. • Stream-stream interaction is considered. • The analysis can be made beyond 1 AU even to • heliospheric boundary.
Time-dependent MHD simulation from 5 to 900AU by HaruichiWashimi @ CSPAR, Alabama Univ. IPS-MHD CAT from SS to 5AU by Keiji Hayashi @ Stanford Univ. IPS CAT from SS to 1AU 1AU 5AU
MHD-IPS CAT Simulation is started from the distance where the SW gets a final cruising velocity such as R>10 Rs. Inner boundary conditions T from an empirical relation with V, N from an empirical relation with V, B from observation and potential field model, V is determined by MHD-IPS CAT. Outer boundary condition IPS observations
Advantages for MHD simulation to collaborate with IPS. • Simulation can starts from distance where SW acceleration is almost completed. • Simulation can use IPS observations as outer boundary conditions.
MHD simulation Hayashi et al.
N V 0.25AU 1AU Hayashi et al.
IPS-MHD Tomography Spacecraft observations
MHD-IPS CAT can obtain solar wind structure at any distance form the sun. Comparison with Ulysses observations in1995~1998 B T N V UlyssesIPS-MHD Hayashi et al.
Time-Dependent MHD Simulation By Hayashi and Washimi • Period: 2001.1.1-2009.12.31 • Simulation Box: 5-900AU • Inner boundary: IPS-MHD tomography map at 5AU by Hayashi • outer boundary(LISM): • Np=0.061/cc • NH=0.176/cc • T=6300 K • BLISM=4.8μG(distance of TS crossed by V1) • BLISM=(225o,45o) in ecliptic coordinate • VLISM=26.3km/s • Solar Wind: • Density variationof SW: 5.0/cc (2005) 3.5/cc (2008) • linear interpolation • Mutual charge exchange (PUI)
Global Picture Of Heliosphere km/s 2009/12/31 Turbulent flow LISM BLIS boundary of Flow
Time-dependent tomography • ICME
Weighting = IPS weighting x estimation error x angular distance
V LOS Sun V fast fast slow slow Longitude