Download
1 / 20
200 likes | 216 Vues
Insights from Norwegian surveys on pesticide use in field crops and greenhouses, highlighting advantages, data collection methods, and resources utilized. Survey design and key findings presented.

E N D
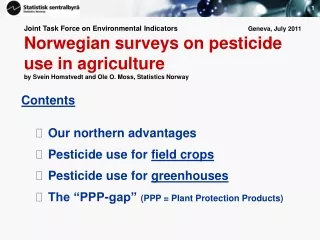
Joint Task Force on Environmental Indicators Geneva, July 2011Norwegian surveys on pesticide use in agricultureby Svein Homstvedt and Ole O. Moss, Statistics Norway Contents • Our northern advantages • Pesticide use for field crops • Pesticide use for greenhouses • The “PPP-gap” (PPP = Plant Protection Products)
Survey on the use of pesticidesGeneva 2011A complex business, but fortunately there are some Northern advantages • Few crops • Less PPPs than further south • System of record-keeping on farm level has been implemented • More obedient farmers? • Some experience gained
Survey on the use of pesticides– field crops Geneva 2011 Comprising the following field-crops: • meadows and pasture land • grain (barley, oats, spring wheat, winter wheat, oil-seeds) • potatoes • onions, common cabbage, carrots • strawberries, apples The population was covering 97 per cent of total agricultural area
Survey on the use of pesticides– field cropsGeneva 2011Content of questionnaires(8 versions) • Preprinted: area of a particular crop • Number of parcels (with the corresponding crop) • Equipment for spraying • Main type of PPP used on each parcel • Detailed use of pesticides on the largest parcel • number and date of treatments • size of area sprayed • name of compound • dosage per decare
Survey on the use of pesticides– field cropsGeneva 2011http://www.ssb.no/emner/10/04/10/rapp_200642/Survey design – field crops • Sampling frame:All holdings applying for governmental grants – except holdings practicing mainly organic framing • Sample size 2008: 4300 (9.5 % of frame) • Sampling plan considering: • 12 types of crops – then 8 questionnaires! • 4 size group by agricultural area in use • both “generalists” and “specialists” • an estimated “toxic load factor - TLF” for each crop(TLF = load of pesticid pr hectar specified for each crop x area of the specified crop)
Survey on the use of pesticides– field cropsGeneva 2011Data collection • 2001 and 2003: postal • 2005 and 2008: postal and web reporting • Questionnaires sent out in November • based on the number of holdings applying for grants pr. July • preliminary results in July the year afterwards • Voluntary response • Incentive: Lottery(3 traveller’s cheques of ca 1000 US$ each) • Response rate ca. 70 per cent (after one reminder) • Quality surprisingly good
Survey on the use of pesticides– field crops Geneva 2011Resources used • Total resource use in Statistics Norway: • 2001: 3 300 man-hours • 2003: 2 300 man-hours • 2005: 1 700 man-hours • 2008: 1 700 man-hours (ca) • 50 per cent financial support by The Norwegian Food Safety Authorities
Survey on the use of pesticides– field crops Geneva 2011Average no of treatments with pesticides. 2001, 2003 and 2005
Survey on the use of pesticides– field cropsGeneva 2011 Share of crop area treated with pesticides. 2001, 2003 and 2005. Per cent
Survey on the use of pesticides– field cropsGeneva 2011 Share of crop area treated withherbicides. 2001, 2003 and 2005. Per cent
Survey on the use of pesticides– field cropsGeneva 2011 Share of crop area treated withinsecticides. 2001, 2003 and 2005. Per cent
Survey on the use of pesticides– field cropsGeneva 2011 Area sprayed with fungicides, by month. Percentage of the total area sprayed for various crops. 2005
Survey on the use of pesticides - greenhouses Geneva 2011 Survey on use of pesticides in greenhouses • A full scale pilot ! • Data collection started February 2009 • Reference year 2008
Salads Herbs Tomatoes Cucumbers Berries Flowering pot plants Cut flowers Foliage plants Bedding plants Survey on the use of pesticides– greenhousesGeneva 2011 Comprising the following crop groups:
Survey on the use of pesticides– greenhousesGeneva 2011 Survey design – greenhouse • Sampling frame:All holdings with a minimum of 300 m2 of greenhouse area • Sample size 2008: 685 (100%) • Sampling plan: • Ranking the nine crop groups by the number of holdings • Sampling all holdings in the crop group with the lowest number of holdings • Sampling all holdings in the next group, deducting those already sampled • Etc.
Survey on the use of pesticides– greenhousesGeneva 2011 Content of questionnaires(9 versions – all most identical) • Area of the particular crop/plant • (Type of flower plant) • Use of biological agents (area, duration) • Type of equipment and type of floor • Detailed use of pesticides • number and date of treatments • area sprayed • name of compound • dosage per m2
Survey on the use of pesticides– greenhousesGeneva 2011 Data collection and experiences – green houses • Only postal • Questionnaires sent out 13. February • Voluntary response • Response rate: 55 per cent (out of the 685) • Work load: More than planned • Quality: Overall good • some elements need to be improved
Survey on the use of pesticides– field cropsGeneva 2011 Comparing two data sources is a risky operation… Used in agriculture Total sales
Survey on the use of pesticides– field crops Geneva 2011 Explaining the gap between total sales of Plant Protection Products and the use in agriculture
That´s all folks ! Experts: Agriculture: Mr. Geir Inge Gundersen (gig@ssb.no) Greenhouses: Mr. Per Amund Aarstad (pam@ssb.no)