Download
1 / 18
180 likes | 385 Vues
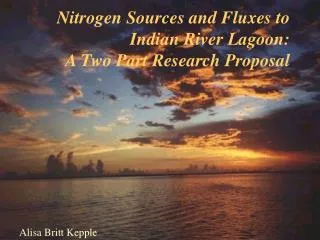
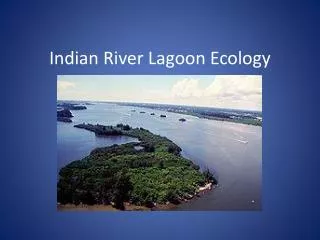
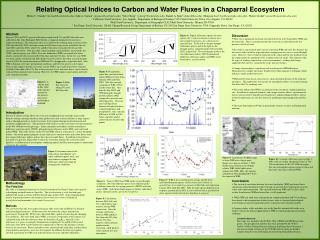
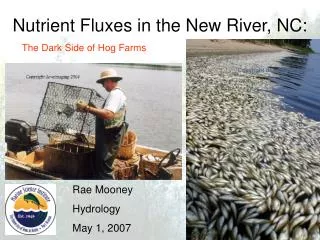
Nitrogen Sources and Fluxes to Indian River Lagoon Ecosystem . GIS in Water Resources CE 394K.3 Fall 2002. Alisa Britt Kepple. St. Lucie Inlet: South Eastern Florida Last stop on the Intercoastal Waterway. 1. Water Quality Sample Collection and Stream Networks: Arc Map Layers.

E N D
Nitrogen Sources and Fluxes to Indian River Lagoon Ecosystem GIS in Water Resources CE 394K.3 Fall 2002 Alisa Britt Kepple
St. Lucie Inlet: South Eastern Florida Last stop on the Intercoastal Waterway
1. Water Quality Sample Collection and Stream Networks:Arc Map Layers • Ideal sample collection sites will be chosen after completion of base map and query analysis – (base map to show idealized collection sites within proximity of most highly populated, commercialized and farmed areas and areas exhibiting highest nutrient concentrations). • Interactive query and trace function analysis to determine most likely point source of highest nutrient concentrations along the stream network
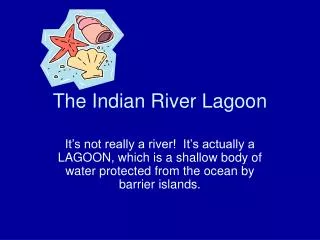
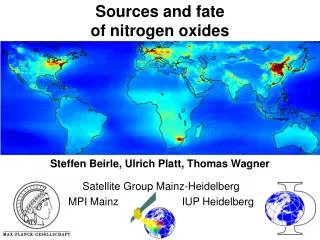
Why Should We Care About DIN and PON Concentrations Leaving the St. Lucie Inlet? * The National Academy of Sciences has proposed that the eutrophication caused by accelerated nitrogen inputs is the biggest threat to coastal resources in the world. The Indian River lagoon provides an opportunity to study the direct effects of agricultural rich - population growth on a regional estuary.
Questions to be answered with this study: • What is the major source of anthropogenically introduced nitrogen to this system? • Fertilizer • Manure • Boat Pump out Positive source identification of nutrients to the lagoon using Arc Hydro GIS stream tracing and multi-stable isotope tracers for positive source identification
The problem at St. Lucie:Storm Water Run-off disrupts the natural ecosytem • Due to increased population, deforestation, agriculture and industrialization periods of heavy rain lead to: • Influx of nutrients • Sustained algal blooms • Reduced dissolved oxygen concentrations- Fish Kills • Obstruct Sunlight - Sea Grass Beds destroyed • Erosion- Influx of Fine Grained Sediment • Sea Grass Beds and benthic fauna populations destroyed
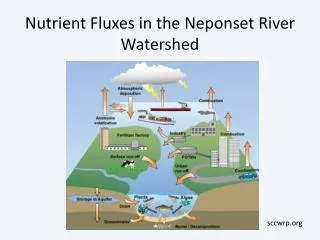
Part One: Nitrogen Sources to the lagoonThe riverine flux increases in direct proportion to • Anthropogenic Sources • Fertilizer • Atmospheric pollution • Nitrogen fixation by crops • import/ export of food and feedstocks • Sewage effluent • Riverine input of introduced vegetation • Natural Sources • In-situ N fixation (absent from most estuaries) • Riverine input of indigenous vegetation
Trying to identify the SOURCE of nutrient pollution is a problem: Phytoplankton uptake and assimilation of the N-15 enriched nitrate Atmosphere N2O 15NO2- Euphotic Zone NO3- 15PON Mineralization 15 DON 15 NH4+ PON (original signal) N-15 enriched PON incorporated in the sediment record 14 N2 NO3- Sediment
The Determination and Relation Between Nitrate Concentrations in Rivers and the Marine Environment • How much nitrate or PON was introduced from a particular source is complicated by: • The occurrence of multiple possible sources of nitrate and PON • Overlapping N isotopic composition between point and non-point sources • Co-existence of biogeochemical processes that alter the stable isotopic signature and concentrations of nitrate which is then incorporated into PON
However, By Running an Additional Isotope on NO3- Multi-isotope studies offer a direct means of source identification because different sources of nitrate and PON have isotopically distinct C, N, O signatures
HUC 03 Indian River Lagoon Counties
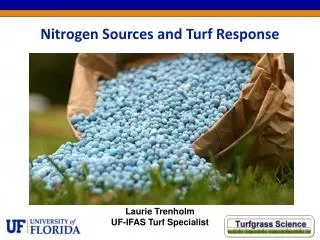
Estimated Nitrogenous Fertilizer Application per County in 2001
Water Discharge Permits and Real time Stream flow Monitoring Stations
Federally Endangered Species • American Alligator • Atlantic Hawksbill Turtle • Atlantic Green Sea Turtle • Eastern Indigo Snake • Leatherback Sea Turtle • Loggerhead Sea Turtle • Short Nosed Sturgeon • West India Manatee • Southeastern Beach Mouse • Bachman’s Warbler • Bald Eagle • Florida Scrub Jay • Kirtland’s Warbler • Peregrine Falcon • Piping Plover • Red Woodpecker • Roseate Tern • Snail Kite • Wood Stork