Multidimensional Visualization
This article explores the challenges and potential solutions for visualizing data sets containing infinite numbers of attributes in 3 spatial dimensions and time/motion. It discusses the benefits of using 3D visualization, the problems associated with it, and introduces the concept of n-Vision as a solution for representing higher-dimensional data sets.

Multidimensional Visualization
E N D
Presentation Transcript
Multidimensional Visualization David Yucht ICS 280 Spring 2001
The Problem at Hand • How do we work with the constraints of our reality (3 Spatial Dimensions + Time/Motion) in order to visualize data sets containing potentially infinite numbers of attributes (n-Space)?
Potential Solutions • Question is moot for < 3 attributes • For > 3 attributes • Use complex 2D displays • Use multiple 3D displays • Add other distinguishing image properties • Use another medium such as sound
Why use 3D? • Utilizes all Euclidian spatial dimensions • Humans have an innate ability to process 3D images quickly without much effort • Images can be enriched with other properties • Time/Motion (4D) • Color • Texture • Shape
Problems with 3D • Computationally expensive • True 3D Output & Interaction requires special equipment • Navigation can be difficult • Data with > 3 attributes require multiple 3D images and/or additional properties • Depth & Occlusion
Early Test Systems • W. Wright: Information Animation Applications in the Capital Markets • Feiner & Beshers: Worlds Within Worlds: Metaphors for Exploring n-Dimensional Virtual Worlds
Information Animation • 4D System for visualizing financial markets • Displays Equity & Bond markets in real-time • Scalable from 1 stock to entire markets • Allows for querying of in-depth information upon request • Utilizes movement/animation to alert users to events and give a “feel” for the market
Information Animation (2) • Animation takes advantage of human visual processing • 4 systems within visual cortex • 1 handles motion • 1 handles color • 2 handle object form • The system thus uses motion, colors, shapes, and sizes to represent information
Financial Properties - Equity • Price • Net changes (days, weeks, quarters, etc.) • Trading Volume • Volume at a Price • Trades at bid • Trades at offer
Financial Properties – Bond • Price • Net changes • Trading Volume • Interest Rates • Yield curve (instantaneous & historical)
Significance of Info Animation • 3D can hold 10x or more data than 2D • 3D allows users to more quickly see market trends • 4D allows users to examine spreads as they occur • Eases interaction & dimensional transformation problems by allowing queries • Avoids occlusion problem by relying on display design and image arrangement
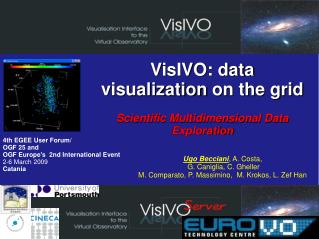
n-Vision • Testbed system for representing n-Dimensions • Uses true 3D imaging for display & interaction • Stereoscopic shutter glasses • VR DataGlove • Handles n-Space to Euclidian spatial transformation by nesting 3D images within one another
n-Vision (2) • Does utilize motion; can be considered a 4D system • Does not utilize other image properties such as texture and color to represent attributes
Nesting Worlds • n-Vision nests multiple 3D images in order to perform dimensionality reduction; it slices away dimensions • Each 3D image is displayed on top of another, with reference marks to illustrate the values where that particular slice lies • Uses recursive parent-child relationships to display & control multiple images
The Significance of n-Vision • Provides a metaphor for > 4D visualizations • Sidesteps the occlusion problem with true 3D interaction • Users can grab and rearrange images • Stereoscopic images give accurate representation of depth • Provides other tools such as the dipstick and waterline to further reduce occlusion and user confusion