Model Assimilation
Model Assimilation. 69EG3137 – Impacts & Models of Climate Change. Details for Today: DATE: 18 th November 2004 BY: Mark Cresswell FOLLOWED BY: Literature exercise. Lecture Topics. What is assimilation? Reanalysis – what is it and why is it? Meteorological stations

Model Assimilation
E N D
Presentation Transcript
Model Assimilation 69EG3137 – Impacts & Models of Climate Change Details for Today: DATE: 18th November 2004 BY: Mark Cresswell FOLLOWED BY: Literature exercise
Lecture Topics • What is assimilation? • Reanalysis – what is it and why is it? • Meteorological stations • Ship and buoy instruments • Radiosonde, dropsonde and Aireps • Climate model assimilation • Spin-up
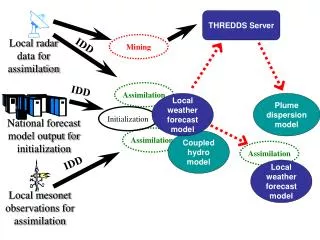
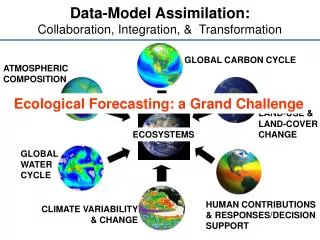
What is Assimilation? Assimilation is a process which involves the collation and analysis of global meteorological observations into a digital georeferenced format Once global weather data is stored electronically it is used to “teach” a climate model the current state of the world ocean, atmosphere and land conditions Once the model “learns” the current global state of the weather it can calculate future change based on these initial conditions
Reanalysis: form and function • In order to efficiently calculate forecast fields for each vertical level and global gridpoint • Climate models don’t see individual points (like meteorological stations) – they see grids of regularly spaced squares • Point data (typically derived from meteorological stations) must be transformed into a smooth gridded surface
Reanalysis: form and function • Once all observations are known (station, ship, buoy, aircraft, satellite, balloon and radiosonde) the data are blended to generate a smooth grid • This observational grid is known as reanalysis • Reanalysis represents the most objective record of what the atmosphere and oceans were like for a specific date and time
Reanalysis: form and function Reanalysis fields are generated for different pressure levels…from surface to 31 or so levels up to the top of the atmosphere
Reanalysis: form and function • Reanalysis may be used as a “gold standard” against which model hindcasts can be compared (to assess model skill, reliability and bias) • Reanalysis may also be used to spin-up global climate change models • European modellers make use of the ECMWF reanalysis covering 15 years (1979-1993) known as ERA-15. We now have ERA-40 (covering the last 40 years)
Meteorological Stations • Around the world are a network of stations where standard meteorological observations are made – coded as SYNOP • Observations are recorded at main synoptic hours only for minor stations or main and intermediate hours for major stations • Major stations are manned • Minor stations may make use of automatic instruments – recording to magnetic tape or relaying data via radio
Meteorological Stations MAIN synoptic hours shown in RED INTERMEDIATE synoptic hours shown in BLACK Data is relayed to the World Meteorological Organization in Geneva, Switzerland via the GTS: Global Telecommunication System Currently there are about 10,000 stations globally (WMO, 2002) 00 03 06 09 12 15 18 21
Meteorological Stations • Data recorded are: • Air pressure • Temperature • Relative humidity • Precipitation • Visibility • Cloud parameters 00 03 06 09 12 15 18 21
Ship and Buoy • As well as land-based observations, the GTS collects measurements of meteorological conditions over the sea – coded as SHIP • These data are collected by: • Ships • Moored buoys • Drifting buoys • Measurements made by ships recruited under the WMO Voluntary Observing Ship Programme. Drifter data is coded as DRIFTER
Ship and Buoy ABOVE: moored buoy LEFT: drifting buoy
Upper Air Measurements As well as land and oceanic surface measurements the GTS collates upper air data. Radiosondes – instruments attached to ascent balloons are used to generate vertical profiles of the atmosphere Aircraft observations are reported from aircraft as well as specific pilot reports. Data from aerodromes and airfields comprise the METAR encoded data Rockets and radar are also used for vertical data collection
Upper Air Measurements LEFT: radiosonde LEFT: launch of radiosonde balloon RIGHT: sounding rocket
Climate Model Assimilation Following the collation of ALL available data into a uniform gridded reanalysis dataset, this is “read in” by the climate model The computer’s memory is used to store the values for each field (temperature, pressure, windspeed etc) for each level (surface, 850hPa, 500hPa etc) When ALL of this data is stored in the computer’s memory and the model initialises all of the variables it uses for each forecast field, the data is said to have been assimilated.
Climate Model Assimilation Specific assimilation schemes may be based on a single “snapshot” of conditions – known as 3D-Variational Assimilation…or it may be based on several days of reanalysis so uses a 4D-Variational Assimilation scheme (the 4th dimension being time!) 4D-Var. is a standard data assimilation method and is essentially a means of estimating the initial conditions of a model by optimising the fit between real observations and predicted 'observations' found from a projection of the model forward in time After assimilation is complete, the model can be run forward in time to generate the actual forecast
Spin-up When global weather observations have been successfully assimilated into a climate model – and it is initialised, the start of the forecast run (the initial period of time being forecast) may produce erratic results The initial period of a forecast run (say the first few days of a 1 month forecast run) is known as the spin-up period. This period varies according to the model used and the period being forecast More specifically, Spin-up is the time taken for a model to reach a state of statistical equilibrium under the applied forcing
Spin-up Cold start: Usually occurs when a model is first initialised and needs to be spun up. For example, if a model is configured in a new domain, it would need to be started in this manner. A cold start could be from climatology rather than reanalysis. The model is then run until a statistical equilibrium is achieved. Warm start: A warm start is a restart of a model, which is used to eliminate or reduce the model spin up time. The saved fields from a recent forecast of the same model can be used to initialise a new simulation, or continue the previous simulation. The saved fields may be used as a first guess for an analysis including new data, and then that field is used to initialise the new forecast.
Practical • TODAY:Using library and online literature resources, find paper references for the following topics: • Natural climate forcing AND sea-level rise • Anthropogenic climate forcing AND human health • Dynamical climate modelling AND hydrology/water resources • Statistical climate modelling AND politics/policies e.g Kyoto • In this practical slot, look at Science Direct and Web of Knowledge • (http://www.sciencedirect.com and http://wok.mimas.ac.uk) • EACH GROUP WILL BE EXPECTED TO SHOW EVIDENCE OF HAVING READ AND UNDERSTOOD PAPERS – DON’T JUST READ THE ABSTRACT!!!!Tutorial NEXT WEEK: based on literature exercise in groups