Updated Low Power SoC Roadmap: Trends, Assumptions, and Design Solutions
This document presents an updated version of the SoC Low Power Roadmap from STRJ-WG1, originally developed in 1999. It details technology nodes, ASIC usable transistors, DRAM capacity, and power supply voltage consistent with ITRS2000. It outlines key trends in operation frequency increase from 150 MHz in 1999 to 2500 MHz in 2014, while power consumption follows a foundational formula. Assumptions for power estimation are explored, along with low power design solutions categorized by speed, size, and overall contributions toward reducing power consumption.

Updated Low Power SoC Roadmap: Trends, Assumptions, and Design Solutions
E N D
Presentation Transcript
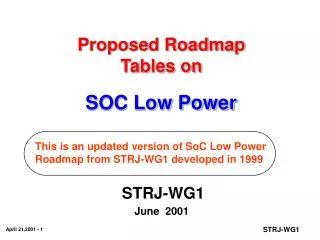
Proposed Roadmap Tables on SOC Low Power This is an updated version of SoC Low Power Roadmap from STRJ-WG1 developed in 1999 STRJ-WG1 June 2001
Technology Node, ASIC Usable Transistors, DRAM capacity, and Power Supply Voltage conform to ITRS2000 update SC2.0. Application is not specified, but surely it is high-end SOC in each generation. Other premises or prospects are consistent with those of “SOC Design Productivity”, such as ; Die size remains around 10mm Logic gate count ratio continuously decreases. Operation frequency goes up from 150MHz(1999) to 2500MHz(2014) . Low Power SOC Low Power Premises & Prospects
Power consumption follows a basic well-known formula, that is Power ∝ C * V * V * f . “C” can be decomposed into “size factor” and “process factor”. Total transistor count and technology node represents “size factor” and “process factor”, respectively. “V*V” is considered as “voltage factor”, and it is just internal voltage. Also, “f” is considered as “frequency factor”, and it is just max frequency. “total power trend” is defined as relative amount of power consumption for each year(2001, 2004, 2011 and 2014) comparing each of above four “factor” for 1999 as unit(=1). Low Power SOC Low Power (cont.) Assumptions
“total power trend” is derived by the following calculation, “total power trend” = “size factor” x “process factor” x ”voltage factor” x “frequency factor” Current SOC power consumption is assumed around 3W. For “size factor”, constant coefficient 0.85 is applied to Memory portion, while 1.0 to Logic portion. Low Power SOC Low Power (cont.) Assumptions(cont.)
Low Power SOC Low Power (cont.) How to derive “Total Power trend” and “Power estimation” Total Power trend = “size factor” x “process factor” x ”voltage factor” x “frequency factor” Power estimation (W) = (Total Power Trend) x 3W (Ex.) in 2004 Total Power trend = 7.71 x 0.50 x 0.36 x 6.67 = 9.25 Hence, Power estimation( W ) = 9.25 x 3 = 27.75 W
Low Power SOC Low Power (cont.)
Low Power SOC Low Power Table
Low Power SOC Low Power Design - Potential Solution Map -
Trade-off line between operation frequency and size(Mtr) is put for each Technology node under the condition to accomplish 0.5W power consumption. A set of potential low power technology is overlaid in accordance with those contribution area and degree of range. Each potential technology is classified into three types( speed, size, and all ) with respect to main contribution. Low Power SOC Low Power Design - Potential Solution Map - What this figure means ….
Low Power SOC Low Power Design Appendix The following two pages are Low Power table and solution map developed by STRJ-WG1 in 1999 based upon ITRS1999 data
Low Power STRJ-WG1 1999 Version SOC Low Power Table
Low Power STRJ-WG1 1999 Version - Potential Solution Map -