Download
1 / 65
660 likes | 816 Vues
Antiparticle to particle ratios measurement using the PHOBOS detector. Vasundhara Chetluru October 11, 2014 University of Illinois, Chicago. Contents. Motivation for studying particle ratios is heavy ion collisions PHOBOS @ RHIC Detector description Like particle ratios analysis

E N D
Antiparticle to particle ratios measurement using the PHOBOS detector Vasundhara Chetluru October 11, 2014 University of Illinois, Chicago
Contents Vasundhara Chetluru • Motivation for studying particle ratios is heavy ion collisions • PHOBOS @ RHIC • Detector description • Like particle ratios analysis • Analysis details • Results & discussion
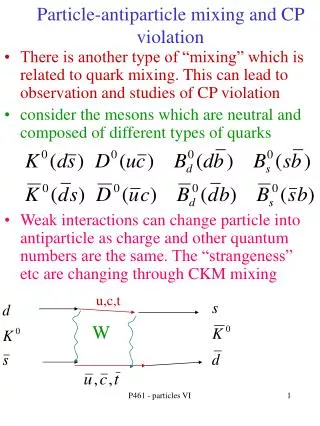
Motivation for studying particle ratios is heavy ion collisions Vasundhara Chetluru Time Initial Geometry Parton Production Hadron Formation Chemical Freezeout Thermal Freezeout 0 fm/c ~2 fm/c ~7 fm/c >7fm/c Antiparticle to particle ratios probe hadron formation & chemical freeze-out stages. In p+p & d+Au collisions little re-interaction is expected thus the ratios should reflect the initially produced yields. Do these different conditions influence the measured particle ratios in Cu+Cu and Au+Au?
Relativistic Heavy Ion Collider 2.5 miles circumference 4 Experiments 5 years and more of running
Relativistic Heavy Ion Collider Vasundhara Chetluru Au+Au: 19.6, 56, 62.4, 130, 200 GeV Cu+Cu: 22, 62.4, 200 GeV d+Au: 200 GeV p+p: 200, 410 GeV
PHOBOS Vasundhara Chetluru system p+p d+Au Cu+Cu Au+Au GeV 410 20 200 100 150 400 250 130 4.3 62.4 110 22 55.9 1.8 22.5 20 19.6 ~1 T0 counter • Scintillator Paddles + Zero Degree • Calorimeter for triggering • TOF wall for high-momentum PID TOF Paddle Trigger Counter • 96000 Silicon Pad channels • 4π Multiplicity Array • Mid-rapidity Spectrometer NIM A 499 (2003) 603 • UIC has led the effort of • Building of Octagon, Vertex and the Ring detectors. • Designing and maintaining of the trigger and its electronics, from 2000 forward. Millions of events to tape
Run V (2005)Cu+Cu datajoined the group Onsite Trigger support Calibrating and maintaining the T0 vertex trigger
Collision Centrality Vasundhara Chetluru Positive Paddles Negative Paddles x ZDC N ZDC P Au Au z PN PP Data Counts Paddle signal (a.u.) Magnitude of signals in paddle counters determines centrality Peripheral Collision: Small number of participating nucleons Larger signal = more central collision. Central Collision: Large Npart “side” view of colliding nuclei “side” view of colliding nuclei Slide from David Hofman’s talk
Like antiparticle to particle ratios Analysis description
Definition Vasundhara Chetluru Identified anti-particle/particle count per event
Definition Vasundhara Chetluru Identified anti-particle/particle count per event As a function of centrality of the collisions and transverse momentum of the particles.
PHOBOS Spectrometer Vasundhara Chetluru Z near mid-rapidity • Two symmetric spectrometer arms give two independent measurements. • Outer 9 layers of the 15 layers are located in 2T magnetic field • Coverage near mid-rapidity and Tracking within 10 cm of interaction point. Schematic Diagram B1 Cartoon • PHOBOS magnet polarity is changed every couple of days. • Two independent measurements are taken for each polarity.
Acceptance Vasundhara Chetluru Z Z Cu+Cu 200 GeV data
Magnetic field settings Vasundhara Chetluru Z near mid-rapidity B2 B1 Z near mid-rapidity For a given bending direction and opposite field settings Ratios are measured independently for different bending directions. 2 Arms X 2 Bending-directions = 4 Measurements
Particle ratios and acceptance Vasundhara Chetluru Backward Bending Forward Bending
Vasundhara Chetluru Measuring particle ratios Tracking – momentum determination. Particle identification.
Tracking in the PHOBOS Spectrometer Vasundhara Chetluru • Road-following algorithm finds straight tracks in field-free region • Curved tracks in B-field found by clusters in (1/p, ) space • Match pieces by , consistency in dE/dx and fit in yz-plane • Covariance Matrix Track Fit for momentum reconstruction and ghost rejection
Tracking in the PHOBOS Spectrometer Vasundhara Chetluru • Road-following algorithm finds straight tracks in field-free region • Curved tracks in B-field found by clusters in (1/p, ) space • Match pieces by , consistency in dE/dx and fit in yz-plane • Covariance Matrix Track Fit for momentum reconstruction and ghost rejection
Tracking in the PHOBOS Spectrometer Vasundhara Chetluru • Road-following algorithm finds straight tracks in field-free region • Curved tracks in B-field found by clusters in (1/p, ) space • Match pieces by , consistency in dE/dx and fit in yz-plane • Covariance Matrix Track Fit for momentum reconstruction and ghost rejection
Tracking in the PHOBOS Spectrometer Vasundhara Chetluru • Road-following algorithm finds straight tracks in field-free region • Curved tracks in B-field found by clusters in (1/p, ∆) space • Match pieces by , consistency in dE/dx and fit in yz-plane • Covariance Matrix Track Fit for momentum reconstruction and ghost rejection
Tracking in the PHOBOS Spectrometer Vasundhara Chetluru • Road-following algorithm finds straight tracks in field-free region • Curved tracks in B-field found by clusters in (1/p, ∆) space • Match pieces by , consistency in dE/dx and fit in yz-plane • Covariance Matrix Track Fit for momentum reconstruction and ghost rejection ∆ Momentum determined with resolution of ~1%
Particle identification Uses momentum and the energy loss
Particle identification (PID) Vasundhara Chetluru • The hits that particles produce provide both momentum information (determined from the position of the hit) and energy loss information (determined from the ionization produced by the particle). • The different energy loss characteristics of pions, kaons, and protons can be used conjointly with momentum to identify the particle type of a track. Cu+Cu 200 GeV MC
Particle identification (PID) Vasundhara Chetluru Pions Kaons Protons dE/dx slice for Momentum=0.5 Bin Cu+Cu 200 GeV MC
PID Bands Vasundhara Chetluru Limit in momentum is obtained by 3-σ limit of the over lapping bands Cu+Cu 200 GeV MC
Raw Ratios Vasundhara Chetluru Cu+Cu 200 GeV Data
Raw Ratios Vasundhara Chetluru Cu+Cu 200 GeV Data
Corrections to the obtained raw ratios The yield of the produced (primary) particles is changed due to a variety of reasons, by the time they hit detector material. Corrections to the measured particles ratios (which are called raw ratios) are applied to account for this change.
General formula correction Vasundhara Chetluru Let h represent the yield and ∆h change in the yield due detector effects or feed-down. This change can be positive or negative. Then h+ ∆h represents the measured yield (ignoring the efficiency correction). c represents the correction factor. This is usually obtained using HIJING monte-carlo generator.
Feed-down Vasundhara Chetluru • Accounts for hyperondecay products. • Mainly effects the proton ratio. • Lambda’s account for the most significant feed-down contribution to the proton yields. As () = 0.26 ns and c() = 7.89 cm • Spectrometer ~10 cm from interaction point. • Apply strict distance of closest approach cut to each track. MC Feed-down Cu+Cu 200 GeV MC
Secondary Corrections Vasundhara Chetluru • As the primary collision products pass through the beam pipe and detector materials, secondary particles are produced. Those which pass through the spectrometer may be reconstructed along with the primary particles. • The effect of secondaries is negligible is kaons. • While the protons and pions have 2% and 1% correction effectively.
Absorption Correction Vasundhara Chetluru Absorption co-efficient Antiprotons Protons pT GeV/C • As the collision products pass through the detector, some of them are absorbed. This results in a loss of anti-particles versus particles and a decrease in the anti-particle to particle ratio. • Correction is obtained by studying the effect of hadronic interactions in the detector using HIJING. • 5%,0.05% and 1% for protons, pions and kaons respectively. Cu+Cu 200 GeV MC
Systematic error study Band-width, Beam-Orbit, DCA cut Paddle-time Difference Track fit probability, Vertex in Z
Systematic error study Vasundhara Chetluru • Systematic uncertainties, which arise from event selection, particle identification cuts, and the three correction factors are studied. • No single uncertainty (parameter) dominates the final systematic error, typically the smallest contribution comes from the PID cuts and the largest from either the event selection or, in the case of the proton ratios, the feed-down correction. • The final systematic uncertainty for a given centrality is determined from the statistically weighted average of the uncertainty determined for each parameter for different arms and bending directions. • A thorough investigation of the track selection χ2probability cut has shown a variation independent of the species and arm, but dependent on the bending direction. Hence, this effect yields a scale systematic uncertainty that, for each collision energy, is independent of both centrality and particle species.
Plot with systematic studies Vasundhara Chetluru • Pions have the smallest systematic variations. • Track-fit probability has the largest contribution for all 3 species. • Systematic errors are studied as a function of centrality bin.
Discussion of results Vasundhara Chetluru • No strong dependence on centrality is observed for the Cu+Cu data. • The final values for the antiparticle to particle ratios of pions, kaons and protons appear to be primarily driven by the collision energy and, within current systematic uncertainties, are largely independent of the colliding system. • A detailed comparison of the central Cu+Cu results at 200 GeV to results from p+p, d+Au, and central Au+Au collisions at RHIC indicates that the antiparticle to particle ratios are, for the most part, insensitive to the collision species. Average pT Open (closed) circles represent √sNN = 62.4 GeV (200 GeV) data. The error bars represent the combined (1σ) statistical and systematic uncertainties
Discussion of results Vasundhara Chetluru • Thermal models • Make the assumption that the initial state has time to thermalize and this “chemical” thermal nature is preserved during hadronization. • Can fit each energy with a common chemical “freeze-out” temperature, Tch, and baryon chemical potential mB. • Suggests a high degree of chemical equilibrium (and thermalization) at the point where particles are “frozen-out” (created). • Baryon transport • Participating nucleons experience multiple collisions • Causes loss of incident momentum and energy • Can lead to “stopping” of nucleon in CM frame; ie. transport to = 90° w.r.t. beam axis. Open (closed) circles represent √sNN = 62.4 GeV (200 GeV) data. The error bars represent the combined (1σ) statistical and systematic uncertainties
Phase diagram Vasundhara Chetluru Temperature (MeV) B Abigail Bickley’s talk
Thermal Models Vasundhara Chetluru Braun-Munzinger, Redlich, Stachel - nucl-th/0304013; Stachel – Trento - 2004 Make the assumption that the initial state has time to thermalize and this “chemical” thermal nature is preserved during hadronization. Grand Canonical Ensemble Have a chemical potential m for every conserved quantum number Constrain parameters with conservation laws Only µBand T are free parameters if look at production.
Thermal Model Vasundhara Chetluru Phys Lett. B. 518, 41 (2001); J. Phys G28, 1745 (2002) • Can fit each energy with a common chemical “freeze-out” temperature, Tch, and baryon chemical potential mB. • Suggests a high degree of chemical equilibrium (and thermalization) at the point where particles are “frozen-out” (created). CTEQ 2006
Baryon transport Vasundhara Chetluru • Proton yield from transport and pair production • Antiprotons generated via pair production The pair production mechanism is symmetric,
Analysis Flow Chart Vasundhara Chetluru
RHIC other experiments Vasundhara Chetluru
Trigger studies Vasundhara Chetluru
Charged particle spectra Vasundhara Chetluru 62.4 GeV 200 GeV centrality PHOBOS Au+Au preliminary preliminary Cu+Cu d+Au Au+Au: PRL 94, 082304 (2005), PLB 578, 297 (2004) d+Au: Phys. Rev. Lett. 91, 072302 (2003)
Flow Vasundhara Chetluru 19.6 GeV 62.4 GeV 130 GeV 200 GeV PHOBOS Au+Au preliminary preliminary Cu+Cu Au+Au: PRL 94 122303 (2005) PHOBOS Au+Au preliminary preliminary preliminary preliminary
Vasundhara Chetluru Rapidity & Transport mid forward Au Au • Rapidity: • Longitudinal motion • Used if PID and p known • Pseudorapidity: • = polar angle to beam axis • Used if PID and p not known • Mid-Rapidity: = 90°, p|| = 0 • y, 0 @ mid-rapidity • Particles measured at mid-rapidity • Generated in collision • Transported from beam rapidity