Download
1 / 26
270 likes | 623 Vues
Structural characterization of worm and spider silk on cross section surface. Weizhen Li. Evgeny Klimov Joachim Loos. Natural Silk. Bombyx mori worm cocoon. Nephila edulis spider silk. NATURE 418 (6899): 741-741 AUG 15 2002.

E N D
Structural characterization of worm and spider silk on cross section surface Weizhen Li Evgeny Klimov Joachim Loos
Natural Silk Bombyx mori worm cocoon Nephilaedulisspider silk NATURE 418 (6899): 741-741 AUG 15 2002
B. Mori Silkworm fibre A. trifasciataspider silk Sericin coating Engineering Fracture Mechanics 69 (2002) 1035–1048 Proc. R. Soc. Lond. B 263 (1996)147-151
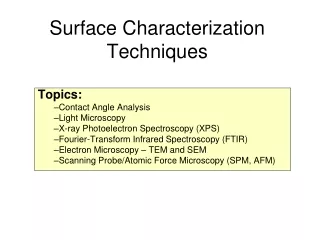
Our task: • Vibrational spectroscopic analysison silk’s cross section • The existence of shell-core structure (Raman mapping, high spectral resolution)
Embedding fibre into epoxy resin Experiment LVSEM Use microtome to cut sample into slices with thickness of 10-30 m
AFM AFM images (phase contrast) of the cross section of B. mori (A) and N.edulis (B)
SPM and positioning control electronics CCD Andor laser electronic control unit SPM microscope XYZ- positioning PMT SPM positioning optics CCD Raman analysis: scanning confocal Raman microscope “Nanofinder” Laser: He-Ne 632.8 nm XY-resolution: 500 nm Z – resolution: 0.5 - 1 m Spectral resolution: 0.01nm Samples: solids, liquids, bulk, thin films, powder
Part One B. mori worm silk
Overview spectrum and bands assignment Surface of degummed wormsilk β sheet J. Raman Spectrosc. 1995 26 901-909 J. Raman Spectrosc. 2001 32 103-107
Raman image of silk cross section Raman intensity distribution of amide I at 1665 cm-1 High spectral resolution
Worm silk spectra with high resolution (After subtraction of epoxy) amide Ⅲ amideⅠ Sample thickness: 30μm Core Edge
Photomultiplier or CCD detector Notch filter Sample Confocal Raman-high spatial resolution without pinhole Principle with pinhole High spatial resolution
Edge and Core area of fibre’s cross section Average 2 m 30 spots 60-70 nm of one step
Raman data of edge and core area Core Edge The ratio I(850)/I(830)is a spectral marker of tyrosine hydrogen bonding strength.
850/830 cm-1 Intensity ratio Stable across entire cross section The ratio I(850)/I(830) is reduced going from moderately to strongly hydrogen-bonded tyrosines.
Part Two Nephila edulis Spider silk
Surface of single fibre—Nephila spider β sheet Conformation J. Raman Spectrosc. 1995 26 901-909 J. Raman Spectrosc. 2001 32 103-107
Raman image Raman intensity distribution of amide I at 1665 cm-1 2 m 30 spots 60-70 nm of one step
Raman data of edge and core area Core Edge
850/830 cm-1 Intensity ratio 1.3 times 1.3 times The strength of hydrogen bonds involving the tyrosine residues may influence the forming of core-shell structure of N.edulis.
AFM image Globular spherical features Diameter: 70-90 nm multiple nanovoids Less pronounced globular structure Multiple 200-300 nm large longitudinal deep voids AFM height (left) and phase contrast (right) images of worm silk (top) and spider silk (bottom)
Conclusion • β-sheet conformation is dominating across entire cross section area in both spider and worm silk fibers. • The comparison of I850/I830 intensity ratio between central and edge area of N. edulis silk displays a higher number of hidden (buried) tyrosine residues in the edge area. • Compared with B. mori wormsilk, cross section of N. edulis fiber reveals less pronounced globular structure with smaller fibrils size containing longitudinal deep voids.
Acknowledgement • For sample supply: Ann Terry • For assistance with sample preparation and SEM : Xuejing Zheng • For assistance with AFM: Alexander Alexeev • Edgar