Download
1 / 26
260 likes | 366 Vues
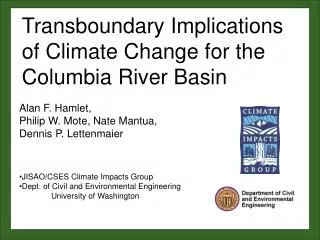
PDO research: a few new insights into lingering questions and a simple method for 1 year forecasting. Nate Mantua Climate Impacts Group October 21, 2003. El Niño. La Niña. Recent equatorial sea surface temperature history. Jan 1983. Dec 1997. Nov 1987. Dec 2002. Jan 1992. mid-1998

E N D
PDO research: a few new insights into lingering questions and a simple method for 1 year forecasting Nate Mantua Climate Impacts Group October 21, 2003
El Niño La Niña
Recent equatorial sea surface temperature history Jan 1983 Dec 1997 Nov 1987 Dec 2002 Jan 1992 mid-1998 to early 2001 Nov 1988 http://iri.columbia.edu/
Typical winter winds and jet stream during El Niño winters An intense Aleutian Low warms and stratifies the coastal ocean
The Pacific Decadal Oscillation • an El Niño-like pattern of climate variability • 20 to 30 year periods of persistence in North American and Pacific Basin climate • warm extremes prevailed from 1925-46, and again from 1977-98; a prolonged cold era spanned 1947-76 1925 1947 1977 1998
Zhang, Wallace, Battisti, 1997 Journal of Climate • interannual SST pattern looks like tropical ENSO • interdecadal SST pattern has more amplitude in the North Pacific, and a “washed-out” ENSO-like pattern in the tropics • simultaneous correlations between ENSO indices and the PDO index are weak
A history of the PDO A history of ENSO warm warm cool 1900 1910 1920 1930 1940 1950 1960 1970 1980 1990 2000 1900 1910 1920 1930 1940 1950 1960 1970 1980 1990 2000
questions • Is PDO variability truly independent of tropical ENSO variability? • Can we predict the PDO index? If so, how far into the future, and how skillfully?
Cool season Aleutian Low variability: (Nitta and Yamada 1989, J. Met. Soc. Japan; Trenberth 1990, BAMS) North Pacific winter climate “shifted” in 1977 ~ 75% of the variance in the NPI occurs at Periods < 20 yrs (Deser et al. in review) 1925 1946
SST and SLP epoch differences: (1943-76)-(1925-42)From ZWB 97 Fig 14
Links between the tropics and North Pacific during winterDeser, Phillips and Hurrell, submitted to J. Clim (submitted Aug 2003) • What are the origins of Interdecadal variability in the wintertime Aleutian Low (as tracked by the NPI)? • What are the links to the tropical IndoPacific region?
Commonly used ENSO indices (CTI, SOI) do not have clear interdecadal shifts ~1925 and ~ 1947 • CTI-NPI relationship not clear 1925-45 Deser et al., Fig 2
Deser et al. Fig 7 • For P>9yrs, the strongest correlations between NPI and tropical SSTs are in the Indian Ocean, far western Pacific, and off equatorial eastern/central Pacific
Tropical Time Series coherent with NPI decadal variabilityDeser et al. Fig 9
Composite tropical index and the NPIDeser et al. Fig 14 • A composite tropical index derived as the leading PC from the 6 tropical indices
Power Spectra and coherence squared for NPI and Tropical Index Note the elevated power and coherence for periods of ~4-8 years and periods > ~20 years Deser et al. Fig 15
Many similarities, yet also some clear differences between the canonical ENSO signatures and those associated with interdecadal shifts • SSTs and stratus decks in the E. Eq. Pacific; SPCZ clouds and precip; North Pacific SSTs; western Eq. Pacific SSTs Deser et al., Fig. 17
ENSO-forced variability of the PDO Newman et al. J. Climate Letters (in press) • PDO variability reflects a “reddened” response to atmospheric “white noise” and ENSO forcing (at all time scales) • Extend the Hasselmann model: Pn = Pn-1 + n To include an ENSO forcing term (En) Pn = Pn-1 +En + n
Climate index lag-correlations, Fig 1 from Newman et al. JFM to FMA • PDO index has most memory starting in winter • NPI has very little memory • NPI leads PDO in winter and spring; NPI from one winter correlates with PDO in the next winter • ENSO variability best correlated with PDO when it leads by a few months, mostly in summer and winter FMA NPI vs NDJ PDO (+9 mo)
Wavelet Power Spectra and for PDO and ENSO: Fig 2 from Newman et al. • Variations in spectral power is similar for both indices, though PDO is “redder” • Energy at P >10 years • North Pac “reddens” atmos noise+ENSO
Simple model performance Forecast vs. Observed Annual PDO (July-June) • Forecast vs Observed correlations • Modeled time series power spectra not as “red” as observed PDO Power Spectra Observed forecast Period
Take home messages from Newman et al. • The null hypothesis for North Pacific decadal variability should include “re-emergence” + “ENSO forcing” • The PDO is dependent on ENSO at all time scales • Predicting PDO may be related to predicting ENSO variability • a 2-year lead-time predictability limit on ENSO? If so, it wont be possible to predict interdecadal shifts in PDO
The Forecast? • July 2002-June 2003 PDO = 1.07 • July 2002-Oct 2003 Niño3.4 ~ 0.57 • Forecast Niño3.4 for Nov-June ~ 0 to .5, let’s guess .3 The Result? Forecast for July 2003-June 2002 PDO ~ 0.80
More questions • Why the lack of variability at periods ~8 to 14 years in both the tropical and midlatitude climate indices? • What are the causes for interdecadal variability in the tropical ENSO? Might they be predictable? • Does the definition of ENSO need to be broadened to include interdecadal variability? • Recent decision by US research scientists uses Nino3.4 values as sole criteria for El Niño/La Niña
Yeh and Kirtman 2003, JGR • Examine annual SST data for 1950-2000 using extended EOF analysis to identify cyclical patterns of variability • North Pacific SST variability has 2 distinct time scales: (1) interannual and (2) interdecadal; the patterns of interannual and interdecadal variability differ • Interannual variability in the tropical Pacific is in equilibrium with interannual variability in the North Pacific • Decadal variability in the North Pacific leads tropical decadal variability by ~ 5-7 years