Download
1 / 1
10 likes | 120 Vues
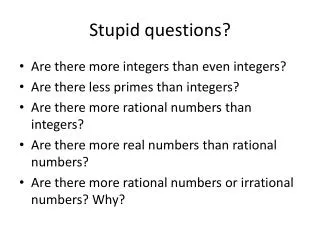
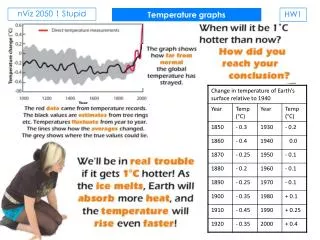
In this project, we explore the .nViz.2050.1 dataset, focusing on the temperature graphs labeled "Stupid." We aim to interpret various trends in temperature data, examining their implications for climate science and future predictions. By utilizing advanced visualization techniques, we reveal patterns and anomalies that could impact ecological and environmental policy decisions. This analysis not only highlights the significance of accurate temperature tracking but also emphasizes the need for continued research in climate change and data representation.

E N D