Integrated Products for Seismic Crisis Support: Damage Likelihood Mapping Using EO Data
70 likes | 190 Vues
This project focuses on developing an integrated approach to generate damage likelihood maps for seismic crises, utilizing Earth Observation (EO) data. It encompasses medium-resolution images (MR) for district-level damage assessment and very high-resolution images (VHR) for individual building damage detection. Techniques include correlational analysis of pre- and post-seismic imaging, integration of multisource EO data, and fuzzy logic for enhanced accuracy. The methodologies aim to improve the assessment of seismic damage and support disaster response and urban planning.

Integrated Products for Seismic Crisis Support: Damage Likelihood Mapping Using EO Data
E N D
Presentation Transcript
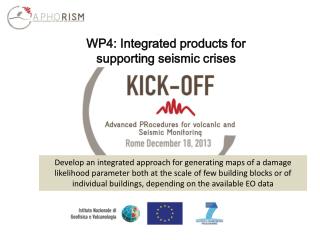
WP4: Integrated products for supporting seismic crises Develop an integrated approach for generating maps of a damage likelihood parameter both at the scale of few building blocks or of individual buildings, depending on the available EO data
EO damage assessment at district level • Medium resolution images (MR) optical and/or SAR enable estimating damage level at district level (regions of homogeneous settlements) according to past experience: • Using one pre-seismic and one post-seismic optical (panchromatic) image, the change image (difference) within a ROI is correlated to collapse ratio from ground survey • Using three SAR images (interferometric set) decrease of intensity correlation and complex coherence within a ROI is correlated to collapse ratio • Coherence is very sensitive to baseline so correlation performs better in many cases Izmitearthquake: groundsurvey Correlationbetweenopticalchange and SAR intensitycorrelationchanges and surveyedcollapse ratio Stramondo et al., IJRS 2005
EO damage assessment at building level • Very high resolution images (VHR) optical and/or SAR enable detecting damage of single buildings, according to past experience: • Pre-seismic image used to map urban area (segmentation by morphological operators) • Post-seismic image, optical and/or SAR, to detect changed segments Changes in SAR intensitycorrelationiscorrelated with measureddamagelevel, especiallyifselectingurbanpixelsonly Chini et al., TGARS 2009
Seismic damage mapping using interferometry • SAR coherence is a powerful change detection tool Example by:
Data integration for a “Likelhood Index Damage Map” • As in many remote sensing applications, integrating many pieces of knowledge may improve final EO product. They are: • Multisource EO data (optical, radar) • Soil vulnerability (antecedent displacement rate) • Building vulnerability, vulnerability class, Damage Probability Matrix (DPM) • Shakemaps • Fuzzy logic is a powerful approach to integrate data from different sources
Soil vulnerability: rationale • Permanent Scatterer Interferometry (PSI) used to estimate deformation rate (mm/year-scale) • Subsidence is an indicator for “thick loose material” subject to compaction • It results in an increased liquifaction probability -5 mm/year +5 Mean displacement rate 2002-2010 (ENVISAT)